Just a somewhat simple and rudimentary Elliott Wave count.
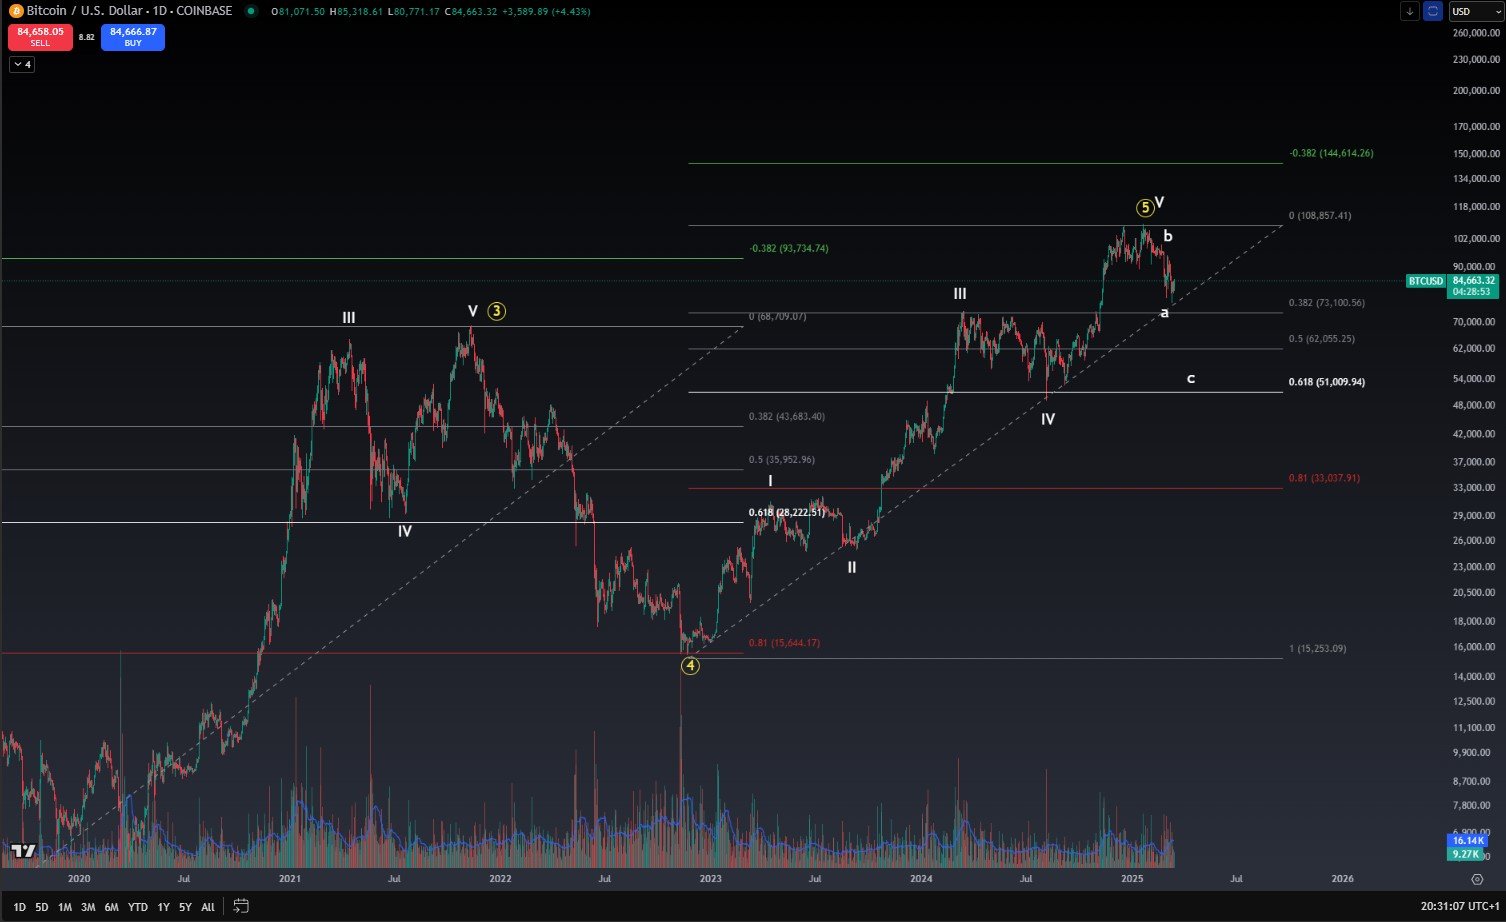
However, I support the fact that the last four bullish waves corrected at the local FIBONACCI level of 0.382, where there also seems to be good historical support on the chart.
This would mean that the bottom is around $73,000 TODAY... This is true if we believe in a simple ABC-type correction, like the one I show, although I don't like it at all since, if we consider the time variable, it's developing quite quickly, so things could get more complicated and reach, why not, the FIBONACCI LEVEL of 0.618... also quite common (51000$).
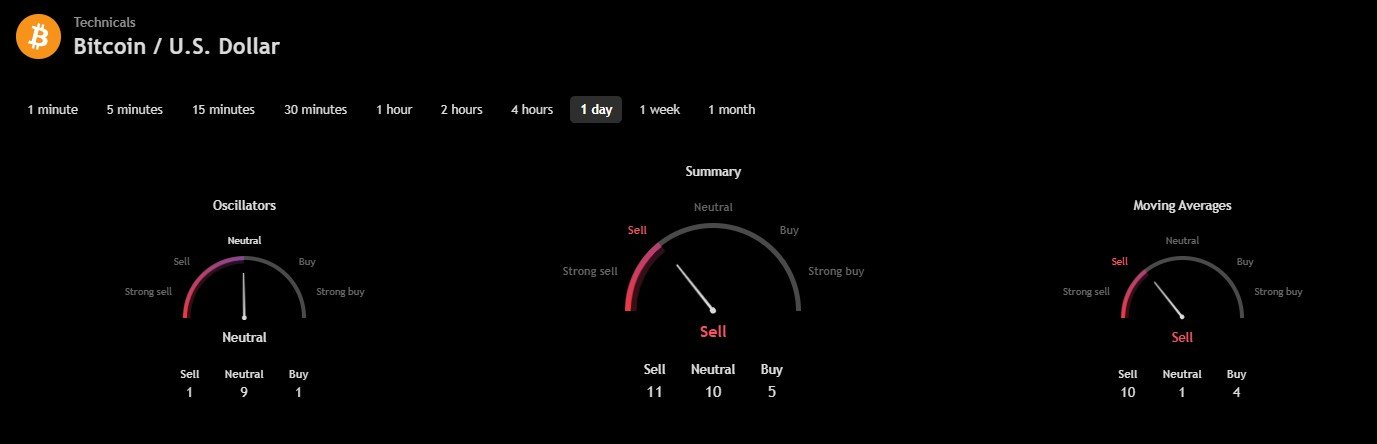
For this coming week, according to the daily indicators, we seem to have some respite in some oscillators... nothing remarkable, it would simply indicate a SIDEWAYS movement, so this is what it is.
Have a great weekend!
@toofasteddie
So you consider a drop to 51k likely? I don’t think so. My base case is another test of the 70-74k area, if things go crazy a slight drop into the 60s but not more. Who is suppoosed to sell? We already have very bad sentiment and a high fear level in the market. ✊🏻
😂
I like your positiveness...
if it becomes complex (535 or 335) then the expected output level should be around 61.8% FIBO, which is 51000$.
My bet is 73K TODAY What I wrote is that 73000$ should be the level of support in case of a simple ABC correction (https://market-bulls.com/elliott-wave-abc-correction-rules/) ,
🤝🏻 73k would be nice.
And yes, positive 😎
Let's see how things go. I think both scenarios are possible. With the trade wars and everything happening with Trump, I think the market can go into a recession, and that would probably pull everything down a bit.
more tariff wars coming it seems, not great... hopefully we get ukraine cease fire
It's just getting started