I’m bored, waiting for the shorter term BTC time frame to shake out and have some time on my hands so here is a brief overview of one of the strategies that I use. This is probably the most basic trading strategy out there save just buying what somebody else tells you is going to go up.
In simplest terms it is setting 2 or more moving averages and buying or selling when a shorter term moving average crosses above or below a longer term average. What time frames you use for your moving averages are up to you, for me I use 7, 21 ,77 for cryptocurrencies as I like it to move a bit faster. In traditional stocks and bonds I typically go with the 10,20,60 or 50,100,200 as they move a bit slower and in most cases lack the volatility of cryptocurrencies.
I am not going to cover all aspects of this topic and I may do follow on articles as time permits, nor am I going to cover using moving averages in conjunction with other indicators.
Ok let’s get to it. For the sake of brevity 7, 21 and 77 refer to a moving average of that many periods. The 7 is Blue, the 21 is Purple, and the 77 is Orange.
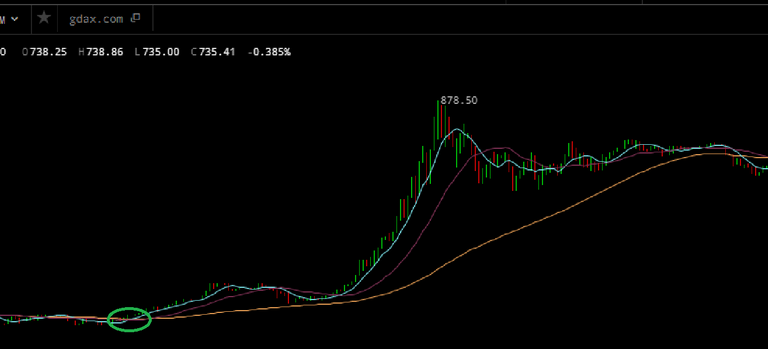
We are going to start with a 5 minute Ethereum chart, and work from there so you can hopefully see how each time frame influences the next and can act to predict what is likely to occur.
In this time frame we see that we had a 7/21 cross to the upside (the 7 crossed upwards and through the 21) at $731. This is typically a weak buy signal but should serve to get your attention on longer time frames as a buying opportunity may be in the works. This occurred below the 77 so it’s mehhh at best at this point as it is just likely to reverse and go back the other way. This was followed by a 7/77 (the 7 crossed upwards through the 77). This is usually a much better indicator as the longer term trend line has been breached and upwards price action is usually the result. Following this event we had a 21/77 cross to the upside as a third buying indicator and likely one that I would bite on in a longer time frame and open a long position.
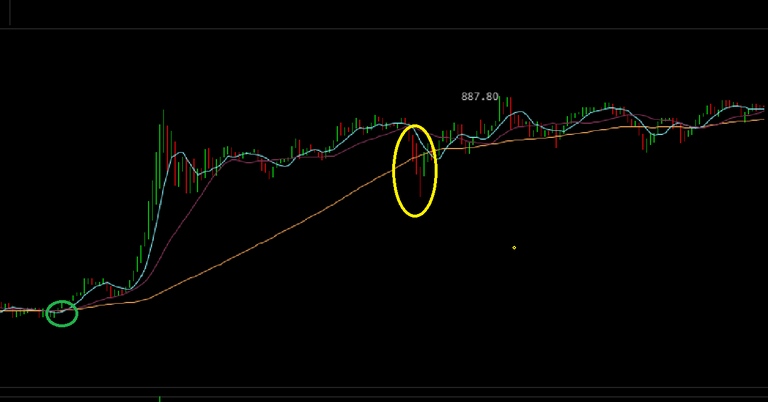
Moving to the 15 minute time frame you see exactly the same pattern emerge. The only difference being that we were already above the 77 prior to the run up. That said we were not without and indicator as the 7 crossed below the 77 and reversed to break it again to the upside just before the run up. You will also notice that once price made a break upwards it had to come back to meet the longer term moving average at some point. This can happen if price comes down, or if price sustains the new higher level and the moving average moves up to meet it and act as support. Once price and the 77 met, there was a brief test of the moving average (yellow circle) and price began to use it as support for future gains and to hold onto its newfound gains.
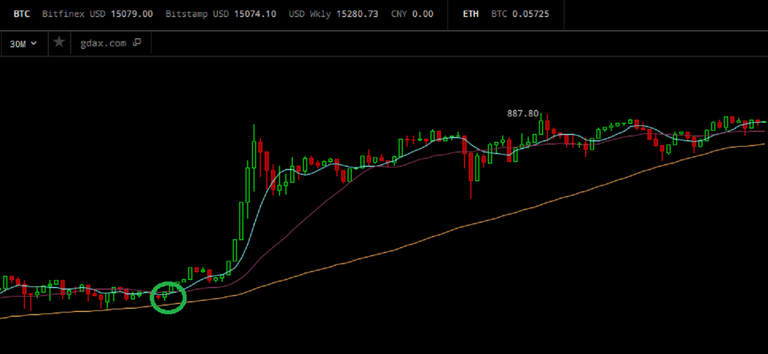
In the 30 minute frame we see a mirror of the 15, there was a bullish cross this time a 7/21, price took off and sought to find support for these new gains at the longer term 77 which moved up to support it.
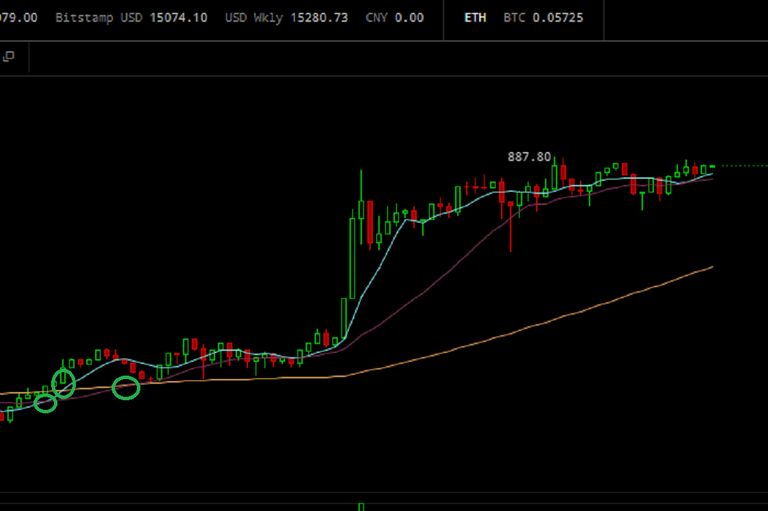
Moving to the 1 hour we see the same pattern beginning to emerge. This time a near mirror image of the aforementioned 5 minute time frame; a 7/21, followed by a 7/77, 21/77 and upwards price movement. By purchasing the 21/77 vs the 7/21 you would of avoided being shook out as price came back to test the 77 following the 7/77 cross before moving upwards.
Now the trend line will attempt to make it upwards to meet these new higher prices and offer support. While I do suspect ETH is going to go up again very soon, I put less faith in the sustainability of new higher highs until the longer term 77 can offer support. It is very likely that we will see upwards price action prior to the arrival of the 77 as support, as traders try and jump the starting gun. There will be an enthusiastic run up followed by an equally enthusiastic sell off as traders lock in their profits and the price comes back to the 77 for support. This is not to say that you cannot buy as you can predict the larger trend based on shorter time frames. Currently I am adding a bit here and there on 7/77 crossovers in the 15 if I see a run up I will be in a good position and when I see a 7/21 cross to the downside on say the 30 I may begin to limit my risk, if I see a 7/77, or 21/77 cross to the downside I can be fairly certain that a short term reversal is in the works and price is coming down to find support at moving averages in larger time frames. My daily prediction today is that price is consolidating as it has support in the 30 min at the 77. Look for a $900-$950 break in the next 24 hours, followed by a corrective sell off as price seeks moving average support.
So how does this help us? Well we can use information gained from chart patterns on one cryptocurrency in an attempt to forecast the actions of another.
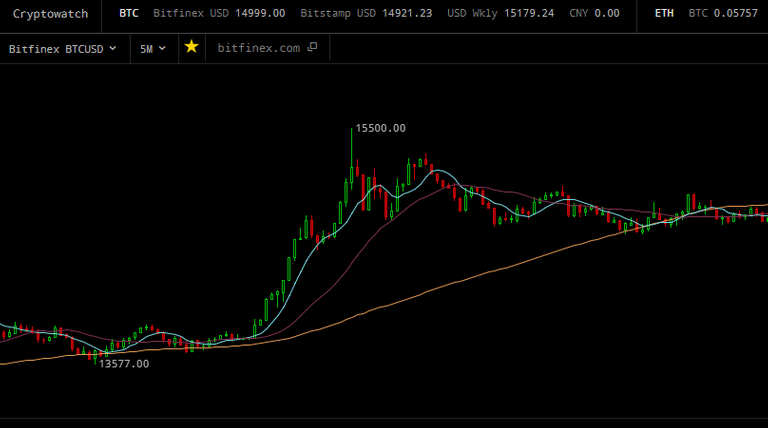
To that end let us look at Bitcoin. Notice any between the 5 minute BTC chart of the most recent run up and the 5 minute Ethereum chart from earlier?
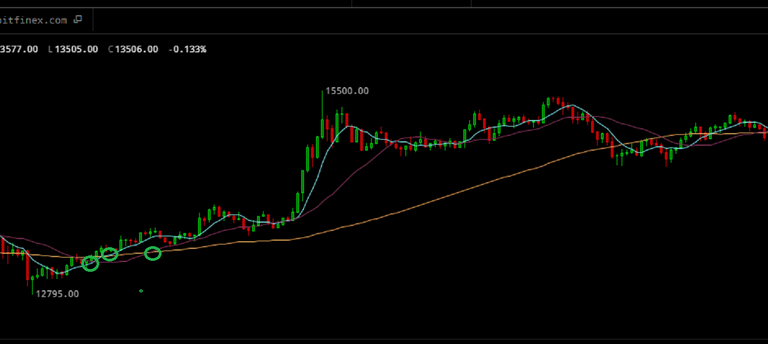
How about the 15? Looks a lot like the Etherium 15 from earlier. 7/21, followed by a 7/77 and lastly a 21/77 before price took off. Now the trendline is moving up to offer support at these higher price points and may serve as a bounce off point for future gains. Look to ETH to have a guess of what BTC is going to do based upon the patterns.
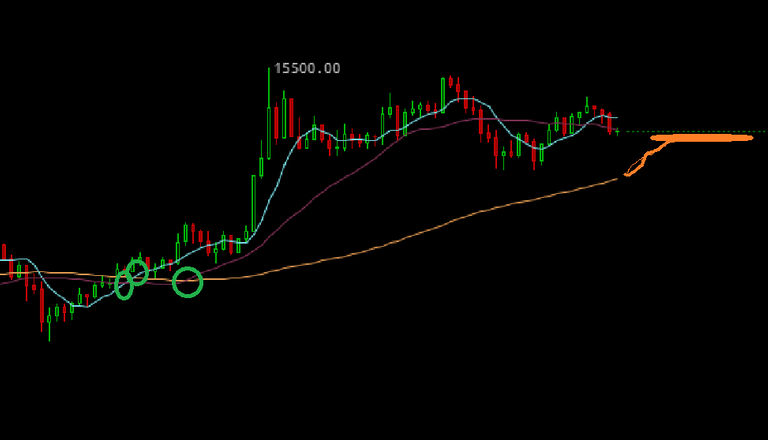
Moving to the BTC 30 minute. We are waiting for support at the 77 to catch up and provide a bounce point for further gains. 7/21, 7/77, 21/77 crosses again.
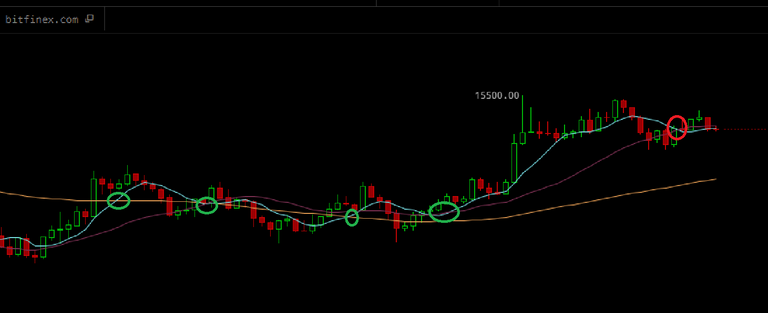
Moving to the BTC 1 hour, we again see numerous Bullish crosses, 7/21, 7/21, 7/77, 21/77 etc. Once again we are waiting for the longer term average to catch up and provide support, until it does we are just as likely to go down to meet it as it is to come up to meet us. Regardless how it occurs price and the longer term average will always in a 100 percent of cases come back to meet each other.
Did not spell check and typed as I thought, sorry if it seems thrown together but this should provide some insight into a very basic trading strategy and how to make simple price forecasts across different cryptocurrencies.
Previous Analysis:
https://steemit.com/bitcoin/@pawsdog/1-2-2017-the-market-view-and-trading-outlook
https://steemit.com/bitcoin/@pawsdog/1-1-2017-the-market-view-and-trading-outlook
https://steemit.com/bitcoin/@pawsdog/12-31-2017-the-market-view-and-trading-outlook
https://steemit.com/bitcoin/@pawsdog/12-30-2017-the-market-view-and-trading-outlook
https://steemit.com/bitcoin/@pawsdog/12-29-2017-the-market-view-and-trading-outlook
https://steemit.com/bitcoin/@pawsdog/12-28-2017-the-market-view-and-trading-outlook
https://steemit.com/bitcoin/@pawsdog/12-24-2017-the-market-view-and-trading-outlook
https://steemit.com/bitcoin/@pawsdog/12-19-2017-the-market-view-and-trading-outlook

Always good information
Thank you for sharing
I've been reading some of your trading posts and being new to trading have had difficulty understanding your terms as well as the 7 21 77 lines or how you get the info. Clearly I'm new to trading as a whole. Any way you can help me understand better? I've had some decent results so far by following your advise as well as others and have had better luck doing "fantasy trades" to see what I would have gotten. However; I'm still confused by some of the terms you use and I'm feeling a little lost
7 21 77 are moving averages. Moving averages are nothing more than a line that averages price movement over a set amount of periods. So a 7 is the average price over 7 periods relative to time frame. So if I am looking at a 5 minute chart the 7 is representative of 35 minutes, whereas if I am looking at the 1 hour it represents 7 hours. It moves quickly as it gets its average from a shorter span of time. The 21 would be average price over 21 periods, and 77 would be average price over 77 periods.
To give you a better idea go here: https://cryptowat.ch/bitfinex/btcusd/15m
That is a free charting service, in the upper right hand corner are tools. Go to SMA (simple moving average) and select your time frames.
This may also help..
https://www.investopedia.com/terms/m/movingaverage.asp
Here is good as well:
http://etfdb.com/etf-trading-strategies/3-simple-moving-average-etf-trading-strategies/
In the last article a 10/30 would be a 7/21 for me. If you have any questions feel free to ask. Also fantasy trading is great as there is no emotion, you can trade like a bot, because there is no fear of loss. The trick is to have that same emotional detachment when real money is on the line. Kinda like being with a girl that's fun to (netflix and chill with) but your not going to be upset if she never calls again- emotionally detached..
Thank you very much for explaining this. The links helped too. Now I can re-observe with a better understanding.
No problem anytime...
Nice intro. I'll definitely be following along more closely now.
Thanks, I tried to make it easy for people to understand. You from what I have read are a bit more on the experienced side, as am I, but I tend to default in many instances to the simplest strategy absent other useful indicators.