Hi everyone, its January 3, 2018 at 9:47 AM and the US and Canadian markets have just opened. Everything is up but barely and my attention isn't really on much today aside from Gold, WTI and BCE
Observation:
1.The first thing I am looking at is BCE as I have been watching it for some time looking for a bottom.

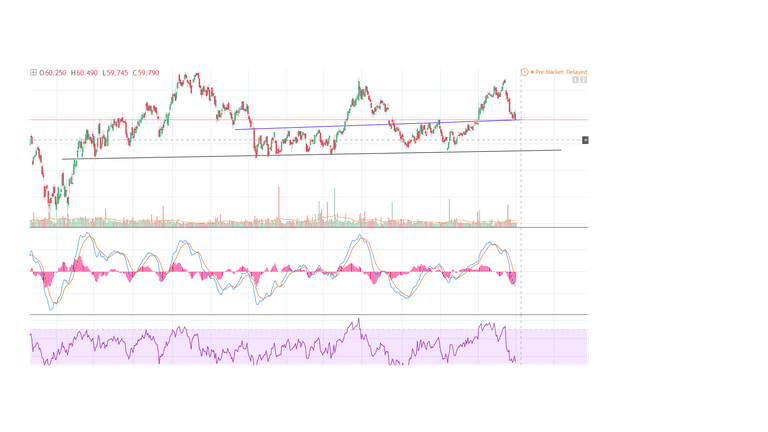
Above is the 1 day graph for the last two years for BCE followed by the MACD and RSI in that order from the top. As can be seen, BCE hasn't strongly crossed the 57$ support represented by the black line in the past two years. The blue line, which is the support I am looking to see tested in the next few days, is at the 59.70$ range. I am watching to see whether or not the blue support line will be enough to hold the stock price or if it will keep going down.
The RSI is also nearing the oversold area which makes it the more interesting and worth keeping an eye on.
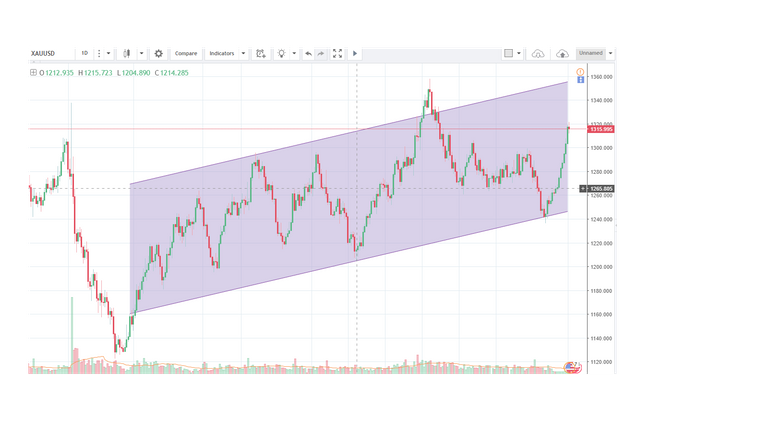
2.Gold is solidly above the 1300$ mark which hadn't happened too often as it traded in a range just below for the whole year. Here is the graph

The channel isn't exact but rather too simplify the observation
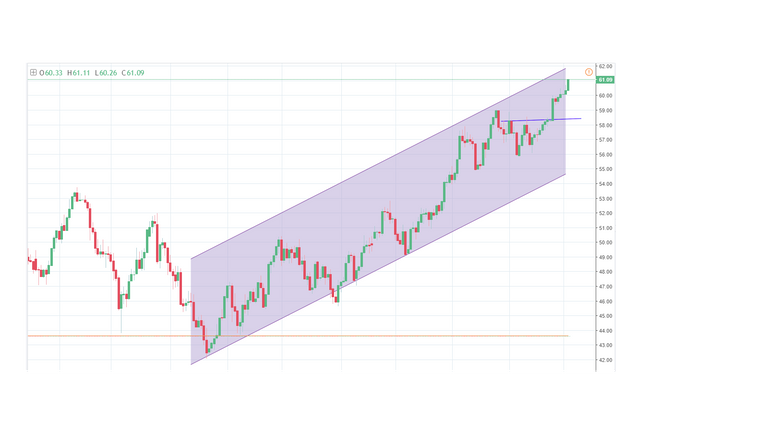
3.WTI is also making moves thanks to geopolitical events but I expect a pullback soon

I expect the pullback to bring price back to about 58.50$ where the support line is placed
Disclaimer: These are just thoughts and observations, NOT financial advice