hello steem ppls,
#BitCoin (BTC) - USD | week 37 | #4
lets have alook into the falling dagger?
What happened last week:
btc went ahead for second SELL Wave.It missed target area(~4.000) about +150pts- we could see also strong trend breaking BUY-backs in (15min/1h bars)
BTC / USD 15 min

yellow: second Sell-Wave Gap (remember, its not finished yet)
BTC / USD 1 day

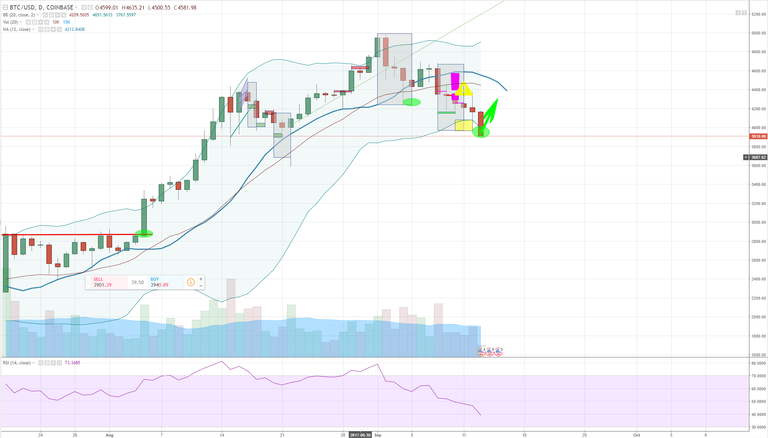
today we will look at 1d chart. bitcoin hit BIG SUPPORT AREA at 3.950-4.000(1d chart strongest django inhood)
-if we see such a fallback from upper bollinger band directly to lower one in 1day bar chart.
The Case Bitcoin plans to continue falling, we will see atleast a smooth buyback to mid bollinger band and moving averages- to test and proof the falling dagger trend otherwise its very, very uncommon
-so tighten your seatbelts be ready for an buyback, get good buyin position in todays shaft,bitcoin is now technically free for new All-Time-Heights
remember btc chart analyses is not case sensitive,prices can be inaccurate cause of price-varities in tradingplaces
i hope this was useful to you. trading crypto is risky
if though iam happy about every upvote and follower!
#TradingView Series are steem exclusive
iam also planing an indicator series, each weak one -simple explained
Donation
->re.steem tradingview series
~| fluffy.blockchain
good job!