(Click here for a full PDF paper)
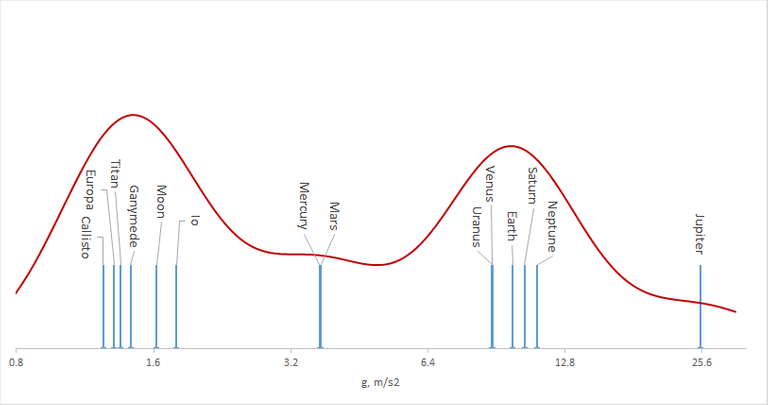
This is a chart of surface gravity for 14 largest Solar System bodies. It looks rather… peculiar:

It looks as if gravity values are clustered. Clustered into four lumps separated by nearly equal width (2.5x) gaps. These lumps consist of:
- Jupiter with its almost triple Earth's gravity (25 m/s2)
- Venus, Earth, Saturn, Uranus, and Neptune. Though quite different in size and appearance, these planets all have nearly normal Earth’s gravity of near 10 m/s2
- Mercury and Mars. The latter is twice heavier than the former, but their surface gravities are neatly positioned at the same 3.7 m/s2, or ~40% of normal.
- Moon, Io, Europa, Ganymede, Callisto, and Titan, all loosely centered around 1.5 m/s2 despite being significantly different in size, mass and composition.
- Triton and continuum of smaller bodies below 0.75 m/s2 (not shown here)
Why does Mother Nature seem to prefer certain gravity values so strongly that this results in visible grouping? After all, gravity is a continuous parameter of complex origin. The natural expectation is that surface gravities of planetary bodies so diverse should be scattered quite uniformly across the range.
But they are not. This is strange, and it calls for some questions.
1. Is it really unusual, or am I just exaggerating my subjective impressions?
The general approach to answering this question is simple. Generate large number (e.g., 10,000) of sets of 14 random values out of log-uniform distribution. Measure clustering quality of each by some objective metric. Count how many times these random sets show clustering stronger than measured for the Solar System’s by the same metric.
If that figure is high — e.g., 30% of all cases — we likely have a subjective illusion at hands. After all, if one third of completely random data sets with no grouping introduced into them clusters better than what I picked as “interesting”, there is probably nothing special about it.
Running this test with two measures (see Appendix B), I arrived at the answer: 0.08%.
In other words, only 0.08% of random data sets demonstrate clustering better than Solar System’s gravities.
So, these groups are real with 99.92% confidence.
2. Do any other parameters demonstrate clustering of similar quality?
The short answer is No.
Obviously, I could’ve not tested all physical variables in the whole Universe. But I tested Solar System masses, radii, Solar distances, densities, extrasolar gravities for systems with 5+ planets, and all extrasolar gravities known with at least 25% precision. None of them have demonstrated clustering more unlikely to arise by a random chance than 3% — and in those cases when it did fall below ~10% there was a known physical cause for it.
Thus I conclude that this clustering is not simply real, but kind of unique to gravities only. That supports the legitimacy of the next question:
3. Are there physical reasons behind it?
Partially. And now this is getting puzzling, somewhat.
One cluster, consisting of Saturn, Uranus, Neptune, and (probably?) Earth could be ascribed to transition from rocky to gaseous planet composition happening through this range of masses. As we know ([20, 25, 80]), the more massive a body within this range is, the more hydrogen, helium, and other gases it contains and so the larger it is. Because of that “swelling”, gravity remains approximately constant 10 m/s2 for planets with a broad range of masses between (roughly) 1 to 100 Earth’s mass, at least within the Solar System conditions. Our analysis detected that and showed a cluster there as expected.
Yet that is not enough to explain all the pieces. Even if you remove giant planets from the analysis, three prominent clusters still remain. Look at these gaps between Mars and Venus, or Io and Mercury: 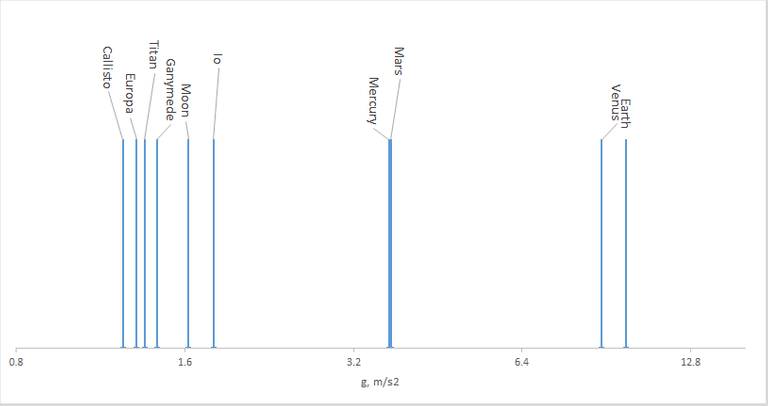
Applying the same tests, I found the probability of “accidentally” producing the same or better clustering of (0.5-0.6)%..
4. Are there speculative physical reasons behind this, maybe?
Being scientifically honest, I shall say that quite likely this all is just a play of random chance. The world is full of coincidences with 1:200 probability of happening, and this could be one of them. Meaning that Solar System gravities are unusual, but there is no unusual reason for that.
After stating that, lets consider other — less likely, but more intriguing — possibilities.
It could be that the laws of planetary and satellite formation prohibited — at least within the Solar System — formation of bodies with surface gravities occupying any of those gaps. While I’m not aware of such laws, and to the best of my limited knowledge nobody is, they still might exist. Planetary formation process is an area of an active research and many fine details of it are still poorly understood.
Finally, the most thrilling possibility is that this clustering is a sign of… observational gap! Meaning that there are bodies in the Solar System with gravity values filling some of those gaps, but we just have not discovered them yet.
What would those speculative planets look like? The most likely candidates are:
a) A KBO object 6000-7000 km in size, with surface gravity of ~2.5 m/s2.
b) A hypothetical Planet X, intermediate in mass between Earth and Uranus, with a surface gravity of ~6 m/s2. The latter figure at least does not contradict gravity ranges derived from masses and radius values given in [70] for putative Planet Nine.
Of course, I am far from seriously suggesting that based on the observation with just 200:1 statistical confidence, but... this is intriguing.
To summarize, I think there is some unsolved mystery here. And who and when will eventually solve it?
Want more detail? Here is a full PDF outlining this small research.
Appendix A. FAQ
Why gravity?
It may fell like rather an artificial variable to study. But let's remember that surface gravity is directly proportional to the product (ρ*R) of average planetary density and its radius. So, when we study gravity, we effectively study that product -- and it does have several interesting properties.
First, it is one of the simplest meaningful combinations capturing both planetary density and radius. If there is a non-trivial correlation between the two, it might potentially manifest itself via the peculiarities of the distribution of Log(g).
Next, both pressure at the center of the planetary body and its total gravitational energy are, to the first order of approximation, proportional to (ρ*R)2. Therefore, interesting phase transitions, or non-trivial interplay between the mechanical and gravitational energy of the body might surface through this variable.
That's why is seems that Log(g) is a physically meaningful object of study.
Did you speak to any planetary scientists about this?
I did, with three actually. One of them had a chance to look at the full paper behind this article. They all pointed out — quite correctly — that without a good physical explanation this observation does not really qualify for a publishable scientific work, and I have to agree to that. Having no time to advance this research further, and with very little chance of completing it alone anyways, I resorted to publishing this for (and to the benefit of) general public.
Appendix B. Details on clustering quality measurements.
Measure 1: Gaps Area (GA).
This measure, which could be viewed as a variation of Davies–Bouldin index [140], is defined as the average size of inter-cluster areas relative to the total span of values considered:

Here c enumerates clusters in the order of increasing gravity, and K is the total number of them.
To apply it, one needs to cluster the objects using some of the standard methods first. For that, hierarchical agglomerative clustering with minimal (or “single-linkage”) merging [40, 50] criteria was chosen for its simplicity and ease of results interpretation, especially in one-dimensional case.
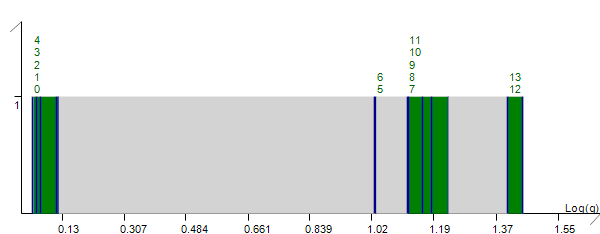
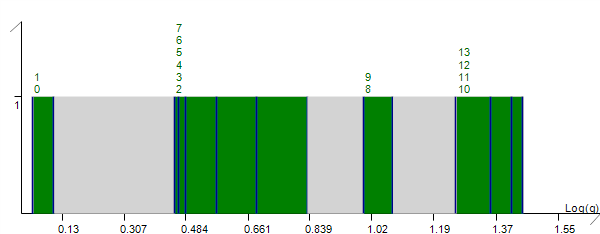
Here are the illustrative examples of artificial datasets with “good” and “poor” clustering quality.
“Good” clustering (large gray gaps, tight green groups):
“Poor” clustering quality: small gray areas, large and loose green groups:
Measure 2: Blur Tolerance (BT)
This approach builds on the ideas behind Kernel density estimation [50, 150] and assesses how discernable the clusters would be under poor observation/measurement conditions.
Starting with a set of gravity values gi, it converts them to a continuous function F(g) via the blur transformation:

Intuitively, that transformation mimics image quality loss caused by imperfect observations. The tighter and more pronounced the clusters are, the more blurring their “image” can sustain while preserving enough contrast to see the clusters.
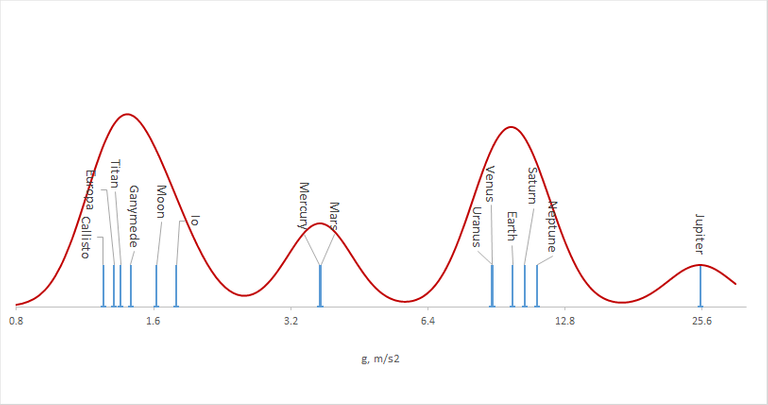
For illustration, four gravity clusters are detectable in the Solar System after blurring with radius r = 0.1:
If r is increased to 0.2, smoothing becomes stronger and only two clusters remain:
The blur radius r (relative to the total gravities span) that preserves at least 2:1 contrast between all K clusters is defined as Blur Tolerance clustering quality measure BT:

In most cases, these measures reasonably agree. However, Gap Area was found to be less robust in a face of degenerative clusters, containing only single elements, or when cluster size is smaller than the uncertainties of the measurements. It would produce elevated scores in such scenarios, as well as when there are multiple single-element “clusters” in the set. Blur Tolerance approach is more robust against those issues and its results should be favored in most conflicts, especially when the clusters are tight or singular.
Appendix C. References.
[10] Katharina Lodders, Bruce Fegley, Jr. The Planetary Scientist’s Companion. New York, Oxford, Oxford University Press, 1998.
[20] Diana Valencia, Dimitar D. Sasselov, Richard J. O’Connell. DETAILED MODELS OF SUPER-EARTHS: HOW WELL CAN WE INFER BULK PROPERTIES? The Astrophysical Journal, 665:1413–1420, 2007 August 20, http://iopscience.iop.org/article/10.1086/519554
[25] Leslie A. Rogers. MOST 1.6 EARTH-RADIUS PLANETS ARE NOT ROCKY. Accepted to ApJ, in press as of 05/12/14, http://arxiv.org/abs/1407.4457
[40] https://en.wikipedia.org/wiki/Hierarchical_clustering#Linkage_criteria
[50] Jiawei Han, Micheline Kamber, Jian Pei. Data Mining Concepts and Techniques, Third Edition. Morgan Kaufman Publishers, 2012.
[70] Jonathan J. Fortney, Mark S. Marley, Gregory Laughlin, Nadine Nettelmann, Caroline V. Morley, Roxana E. Lupus, Channon Visscher, Pavle Jeremic, Wade G. Khadder, Mason Hargrave. THE HUNT FOR PLANET NINE: ATMOSPHERE, SPECTRA, EVOLUTION, AND DETECTABILITY. https://arxiv.org/abs/1604.07424
[80] Fernando J. Ballesteros, B. Luque Walking on exoplanets: Is Star Wars right? https://arxiv.org/abs/1604.07725
[110] The Extrasolar Planets Encyclopaedia, http://exoplanet.eu/
[140] Some well-known measures of clustering quality on Wikipedia: https://en.wikipedia.org/wiki/Cluster_analysis#Evaluation_and_assessment
[150] Kernel density estimation overview: https://en.wikipedia.org/wiki/Kernel_density_estimation
(c) Eugene V. Bobukh
Congratulations @eugenebo! You received a personal award!
You can view your badges on your Steem Board and compare to others on the Steem Ranking
Vote for @Steemitboard as a witness to get one more award and increased upvotes!