Intro:
Using the Ichimoku Cloud as my trading tool and making a testable prediction about the direction of the price.
Quick definitions:
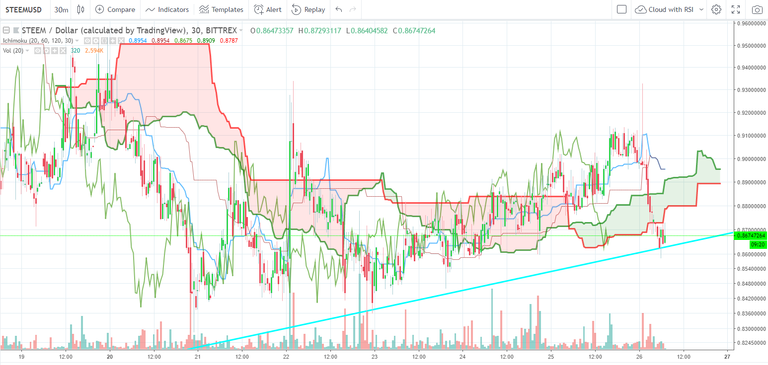
The Blue line in is Tenkan-Sen (Conversion Line). It’s the midpoint of the last 20 price bars.
The light red (non-thick) line is Kijun-sen (Base Line). It’s the midpoint of the last 60 price bars
The Green (Thick) line is Senkou Span A (Leading Span A).
The red (Thick) line is Senkou Span B (Leading Span B). Both leading spans are plotted into the future.
The green line is the Chickou Span (Lagging Span), and will always lag behind the price; it’s the most recent price, plotted 30 periods back.
8/25/2018 1:49 pm MST
imgur:
30 min: https://imgur.com/a/eOhMsD5
2 hour: https://imgur.com/a/apHj5if
30 min

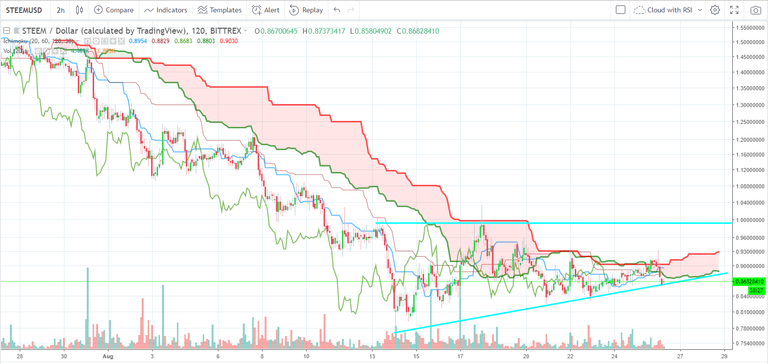
2 hour

Steem had a pretty decent day today. It spent most of the day above the Leading Span A and the monument started building positively. Sadly towards the end of the day it plummeted through the Tenkan-Sen and went through both Spans and bounced off of my blue trend line - which I haven't moved since day one. Further it seeing some resistance again at leading span B making me think we won't see any major breakouts. And probably a dip back into a red cloud in the 30 minute time frame.
The two hour time frame is still looking as though it's trading side ways. Seeing resistance at the leading span B. Without some real volume building I doubt we'll see much movement. However, oddly enough, my trend line seems to be holding (Trend lines are totally arbitrary and are broken a ton, they might even be meaningless - despite what other traders might say) which is a good sign. This might turn into a ascending triangle formation but i kind of doubt it.
Prediction:
I think the price won't be going much above 90 cents. But the more times it tests that 90 cent resistance where the Leading span B (2 hour) is sitting. The more likely it is to break and make a move up.
Prediction: trading sideways for the next 24 hours near 90 cents to 87
Current prediction results:
Yesterday I said that it would sit between 89 and 85 cents. When I looked today it was at 86 cents. While that's good. I don't think it spent more than 50% of the day within that range. Or at least, it's a tough call. But based upon my rules from day 1. I'm calling yesterday's prediction a failure. Which means I'm currently at a 50% ratio.
Experiment day one - includes my rules
Current prediction rate: 50%
Conclusion:
Feel free to leave feed back, comments, and suggestions on anything - from the rules, to the quality of my TA, to how I could improve, ect.
If you are wondering why I'm doing this or why I'm creating rules or testing my predictions. Follow this link.
If you liked this content feel free to reblog, follow, and comment.
Who is klabboy?
I’m different than some steemians. I have never been be paid to create content (baring likes from fellow steemians), I have never paid for upvotes, and all my content is 100% created by me. Nothing fake, no agenda, just my thoughts, and your comments.
Further, I’m a stutterer, crypto-enthusiast, economics student, data nerd, and outdoors lover. I post mostly on economics, data, personal fun/stories, and crypto. If you have an interest in those things and the occasional random topic, feel free to like, follow, and reblog my content. Hope to hear from you in the comments! Have a wonderful day!