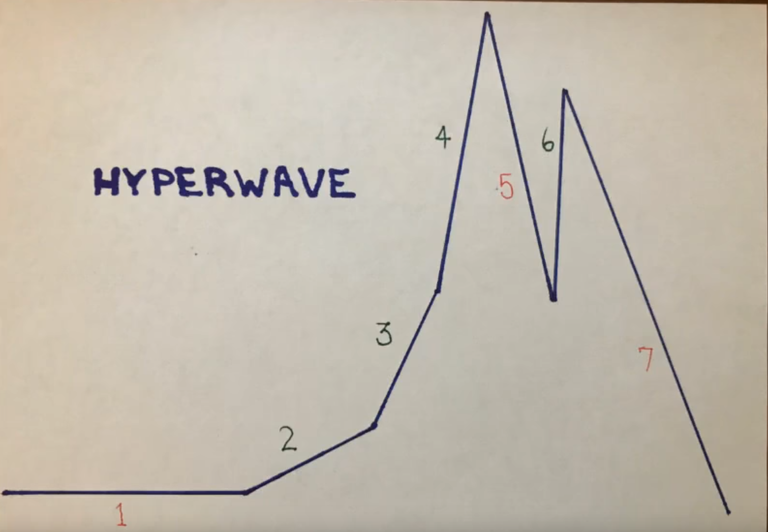
So @sacred-agent turned me onto a Technical analysis approach called Hyperwaves. It takes the standard guideline for how bubbles works, and adds some more details to the rules.
Hyperwaves
You can find more information on hyperwaves here
General Guideline for Bubbles

This is what a standard bubble looks like!
Now let's layer on the Hyperwaves map (if it's red the price stays below if it's green the price stays above)

The last thing I wanted to mention was bitconnect- What may be the first hyperwave in crypto!

Here's the price chart for Bitconnect. Pretty easy to spot the match to the general bubble guideline
Ok, so, now I've put in the numbers that corruspond to Hyperwaves.

You can see a pretty standard map for lines 1-7 that fairly accurately call most of the touch points for bitconnect. It didn't seem to have a common touch point between lines/stages 2&3. So, that makes that piece a little tricky to spot as it's going, but otherwise you can see all of the stages and they look to align with the bubble chart and the more specific guidelines of hyperwaves.
Timing
What's fascinating is that timing of these things is usually in the decade length of time, but here we're seeing bitconnect run that in under two years. That also goes well with what JP Morgan guys just said of "cryptocurrencies are moving like the Nasdaq back in the 90s, but about 15 times faster!"
So, why do I care about a completed one?
It shows that these bubbles can take place in under 2 years. It's a guidepost relative to stocks where they can take 10-30 years, and there's one in bonds going on for over 50 years right now.
What do I do with this info?
You look at things that seem to be in bubbles and then make some better guesses knowing some guidelines of how these prices tend to move while in a bubble; namely, they stay under line 1, over line 2,3,4, under line 5, over line 6, and under line 7. If it's following the general guidelines you now have a good idea of when to call tops and bottoms because it breaks the line.
TA is tea leaves?
Some people think this is all reading tea leaves. That's ok. This approach might not be for everyone. I'm also not an expert. I'm learning this as I'm going. So, don't take my word as gospel here, but I wanted to share some of what I'm seeing from people that have done this for 40+ years. Currently I don't think it's tea leaves, and secondly I think bitcoin is still in a hyperwave (stage 3). Hopefully, this informs you with an extra idea of how to trade bubbles in general and give you a sense of how long a bubble might last in this market.
This isn't meant to tell you to buy or sell, but is one potential thought in the Technical Analysis sphere that may provide informational incite for you to make better decisions on your own.
I'm not sure applying this chart to an outright scam like Bitconnect has any bearing on legitimate cryptos, but cool post anyhow.
Thank you for the Article, I resteemed because I saw the name BitConnect inside.
I myself was an investor in BitConnect and I lost all my hard earned money, though I still consider that it was entirely my fault that I couldn’t see the Red Flags the platform had.
Right now I look at my wallet which has a lot of BCC which are worth practically nothing.
They are there just to remind me of my Mistake 😂😂@aggroed
One small edit
The stock market looks like it's at point 6 right now while precious metals might well be just starting point 2, have experienced a bear trap post 2011. Imagine the prices of gold and silver over the next 5-10 years if that is the case!
Well said about crypto and nice information steeming on bubble writing.
Yet your article is appreciated. Always follow your wonderful post.
If you take a close look at it,you will have a very clear idea about the market.Such a high quality post.If have shown hyperwaves,bubbles very effectively .Now even those people who had no idea about this they also will be understand it clearly,this will help people to make better decision.@resteemed
Thank's for sharing such informative post.This will help me to make a better guess.You have shown every thing very nicely.@upvoted and resteemed
This was a great post very informative. Thank you for sharing your experiences, you are doing great.
These contributions are the ones that are really needed in steemit, publications that
provide something good ... You have my congratulations, keep.
Thank you very much. you are the best.. I think I want to learn and practice that....
How lucky I am because I can read your post, that are many knowledge... I want to share to my friend too..
Well i keep reading this post over and i still dont know how this hyperwaves work. Can you use it on the steem market and tell us what the charts says
Mantap...
This great information I appreciate your crytocurrency news thanks for sharing..
Really thanks for sharing this bubble study reports and literally speaking i still haven't entered in infant level in Cryptocurrencies and still exploring different posts to study the different market aspects and learning inputs and trying to study the reports and also trying to compare these reports with past results to understand the accuracy percent. I am still in learning stage and learning more and more. Thanks for sharing and wishing you an great day. Stay blessed. 🙂
@sacred-agent is in South Florida, was trying to get him to join us at the meetup but he works Fridays and Saturdays.
As for the hyper wave, yeah...it's basically what I call the FU top and as much as I saw it in BTC....I just kept saying - "this will be the fastest it's ever happen in an investment, can this really happen already" which in the end was just me talking myself into to holding on when the January top was sorta obvious....oh well lol.
I'm just hoping the BTC mean is that long-term uptrend line I have drawn that seems to keep holding.
Despite you not being an expert, you touched and captured how the market works.I am studying how the market works, so am still learning
Thanks for great post..i appreciate this cryptocurrency..all the best...
The best indicators of hyperwaves is listening to people talking about the market. The first chart you have from enthusiasm to despair is the best indicator of market condition.
TA... you can always see something in a chart.
And it is usually a better than average indicator of what is going to happen.
But, you have to remember, the market is always right.
Very interesting @aggroed does your second last paragraph indicate you think bitcoin is a bubble?
I think also that TA is a good indicator, but not more. It can't predict the future very well. But human nature and their reaction is something you can predict when fear and greed. What do you think?
it seems like most cryptocurrencies are doing that annually, a big run up in fall and then a collapse after the new year.
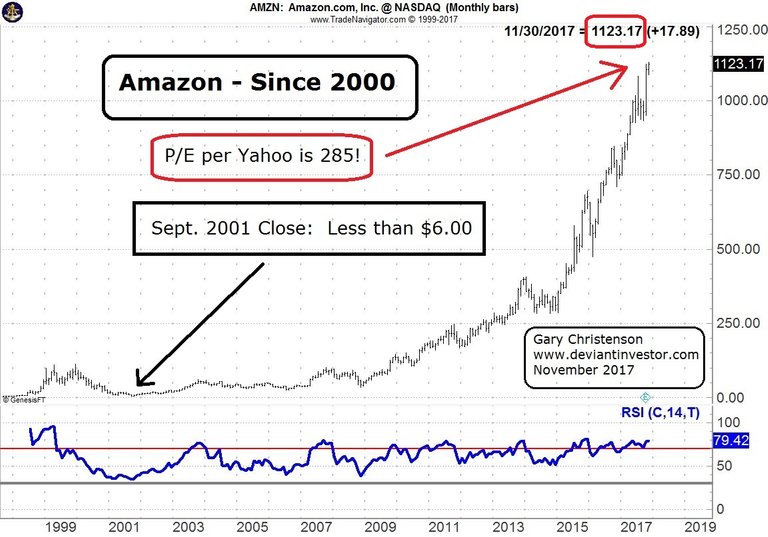
Remember.....Amazon Bubble...Small blip

Wont hold a candle to BTC's growth
Great post
thank you very much for your best post
This is really valuable. And I've found all things have patterns. Where it becomes tea is when there's differences in what's being tracked. For instance, a real pumpdump is going to have a different kind of pattern than something that has a solid backbone. Something based on want is going to look different than something based on need. Something that's not that marketable or taboo might not get the same media attention. Many factors are involved but overall, I think there is some truth to pattern. Human behavior is reasonably predictable although there's always surprises- which is part of the predictability.
Thanks for sharing this. I'm going to go have a deeper look into this model.