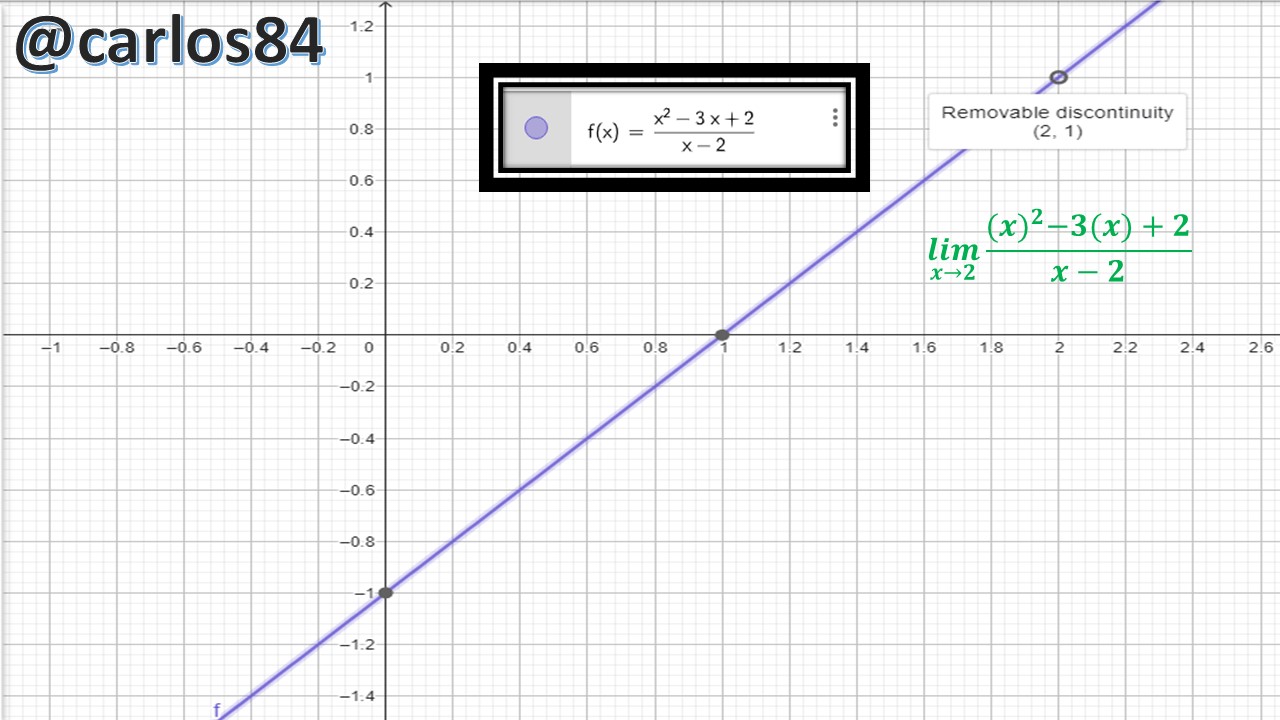
The discussion is given in the book Calculus with Analytic Geometry Volume I by Larson, where on page 56 of Chapter I the following limit is given as an example:

The debate lies in the fact that it is proposed to solve this limit by estimating it numerically, for this a table can be constructed where values for X are approximated by left and by right coming very close to two but without being two. Then you can verify graphically what happens when X approaches two and know which is its image in Y.

As can be seen in the table as the limit of the rational function tends to 2, we simply approximate the values on the left and on the right so that they get very close to 2, but without being 2.
The value that comes closest to 2 on the left is the value of 1.999 and the value that comes closest to 2 on the right is 2.001.
The idea is to find the values of f(x) for the values of X indicated in the table.
I am going to make an example of how the image is calculated when X= 1.75 and in the same way it is going to be calculated for the other values of X in the table:

When X takes the value of X= 1.75 the image of f(x) is:

If we perform these calculations for the values of X in the table we would have the following form:

In the table we can see that as the values of X approach 2 from the left the closest value of f(x) is 0.999. And if we see how the values of X approach when they get very close to 2, the closest value of f(x) is f(x)= 1.001.
When the values of X approach 2 from the left f(x) gains values until it gets very close to 1. When the values of X approach 2 from the right f(x) loses values from 1.25 until it gets to 1.001.
This means that even though if we solve the limit when X tends to 2 by simply substituting the value of 2 in the X, it will give us an undefined limit, as shown:

The division by zero is not mathematically defined, which means that the limit gives infinity, however that does not mean that when the rational function takes the value of X=2 there is no value for f(x), only that the function in discontinuous avoidable at X=2, and that we could actually see in the table how when X=2 then f(x)= 1.

The limit of when X tends to 2 exists and is equal to 1. The meaning that first gives us the infinite limit, and then verifying the values by the table we realize that when x=2 f(x)=1 is because the rational function is discontinuous avoidable for X=2.
The other way where we can verify this value of the limit when x=2 is by making the graph of the rational function using geogebra software:

There the geogebra program tells us that at the point (2,1) there is a point that has a removable discontinuity, that is to say as I explained before, that first if we solve the limit by substitution the limit will give us infinity, however the reality is that the limit exists and is equal to 1.
Recommended bibliographic references
Larson and Hostetler's book of calculus with analytic geometry. Volume I. Year 2007. Seventh edition.
Note: All equations in this post were prepared using Microsoft PowerPoint's equation insertion tools. The graph of the rational function was made using geogebra software.
Thanks for your contribution to the STEMsocial community. Feel free to join us on discord to get to know the rest of us!
Please consider delegating to the @stemsocial account (85% of the curation rewards are returned).
You may also include @stemsocial as a beneficiary of the rewards of this post to get a stronger support.