Welcome to Candlesticks Simplified with Cryptolu where every thing technical analysis is made simple. It's an interactive class so do well to share your thoughts whenever it's needed. Let's get started.
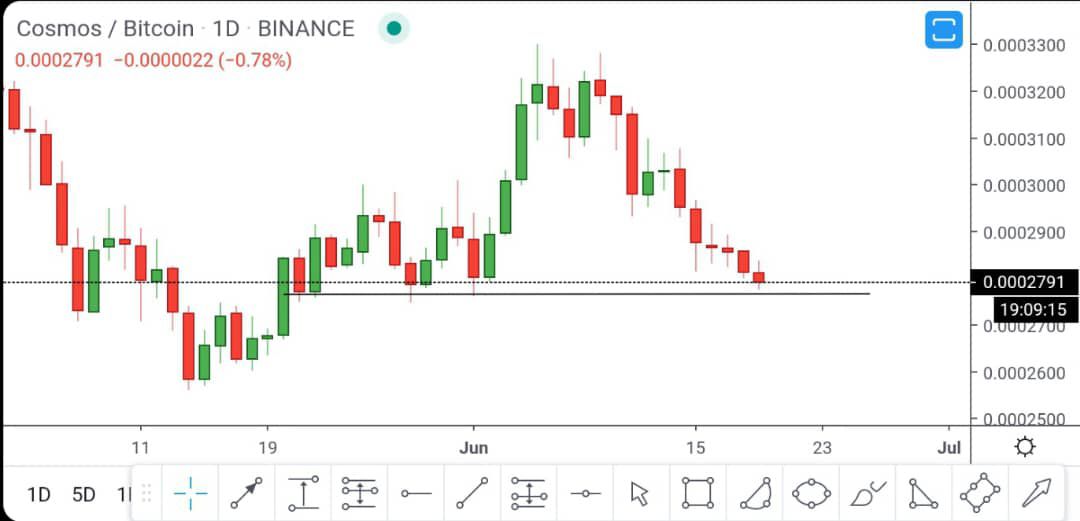
Have you ever seen a chart like that before 👈🏾? Maybe you were just going through someone's timeline and you see a chart like that. What's the first thing that comes to your mind?
For most people, the first thought that comes to their mind is "What is this nonsense this guy is always posting", "Wow. This is beautiful. If only I could learn how to read this thing", "This thing must be very hard o see as the thing be". Thoughts like that keeps entering our mind without us really taking note of it.
Now the purpose of this class is to simplify that chart so whenever you see it next time it won't look strange to you. Do I still have your attention?
Good. In simple words what you see on that chart "the green and red thing that is just going up and down" is called the footprints of money.
Yes. It is what it is. Those footprints are what the people that tell you they are forex or crypto traders use in making money. I'll explain what I mean by footprints of money. Follow me🛴.
It's a rainy day and you want to go out to get something very important though the rain has reduced and every where is muddy and wet already. You put on your boots (for those who wear boots) or slippers , grab your umbrella and head out.
As you walk on your streets, whether you are aware or not you're leaving footprints behind you as you walk silently on the road while looking for a bike or cab. These footprints can be used to track you and possibly predict where you are headed to.
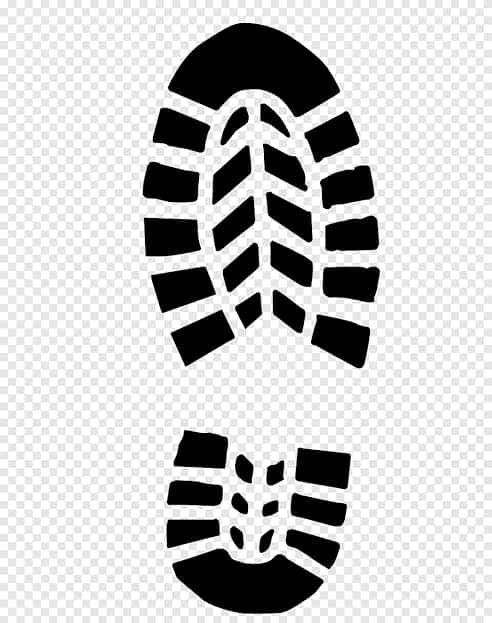
The only way someone can predict where you're headed with your footprints on a road where there are a lot of footprints is if the person knows the brand of your boot/slippers and has a knowledge on how to check for them.
This is the same way money leaves footprints on the charts that trader's use to predict where a asset or instrument they trade will go to and profit from it.
Just like our footprints consists of two prints ( Right and Left Leg:as seen in the footprint picture) that is the same way money also gives us two different footprints. These footprints of money are called CANDLESTICKS in trading.
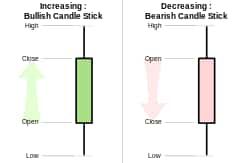
Don't confuse yourself with that image 👈🏾 Please Don't. You'll understand what it means very soon. All I want you to see there is the Green and Red footprints of money (CANDLESTICKS) there.

Look at the man in that picture what do you think will happen to the man when he takes a step forward again? One leg will go to the front while another one will go to the back right? Yes that's the same thing that happens with the footprint of money (Candlestick). The leg moving forward is the Green footprint (Candlestick) of money while the leg moving backward is the Red footprint (Candlestick of money)
Just like our legs, the footprints of money (candlesticks) also swing to the front and back when moving. The green footprint of money (candlesticks) swings to the front while the red footprints of money (candlesticks) swings to the back when moving. Do you understand?
From now on, I would stop using the word footprints of money and start using Candlesticks. I hope am clear?
Now the green Candlestick that moves to the front shows that the chart you are looking at is moving forward and whenever you see a red Candlestick it means that price is moving backwards. Simple right? Good.
A recap of what i said last is Green Candlestick means price increase while the red Candlestick means price decrease. For example let's say we live in a world where charts is what is used to determine the things we buy and sell daily in the market.
So if I'm thirsty and I want to buy Pepsi what I will just do is open my Tradingview app( It's a app used to check prices of assets and instruments) and check for the current price if it's low around 100 dollar and I can quickly buy and drink before price goes up. Smart right?
Now let's say I buy that same Pepsi to sell again later and the price I bought it is 100 dollar and I start seeing red Candlesticks on my chart making the price go back to 80 dollar then I'll know that the money I invested to buy Pepsi is in a loss of 20 dollar. And also if I buy at 100 dollar and after some hours or days i start seeing green Candlesticks that makes the price go up to 150 dollar then I know surely that I'm in profit of 50 dollar.
I just explained what trading is all about in simple terms in the last two paragraphs👈🏾so if you weren't paying attention to it go back and read again. Now back to Candlesticks.
There are three types of phases in which Candlestick moves
- Uptrending (It is increasing)
- Downtrending (It is decreasing)
- Range / Consolidation. ( moving sideways)
Sounds complex right? I'll break it down now.
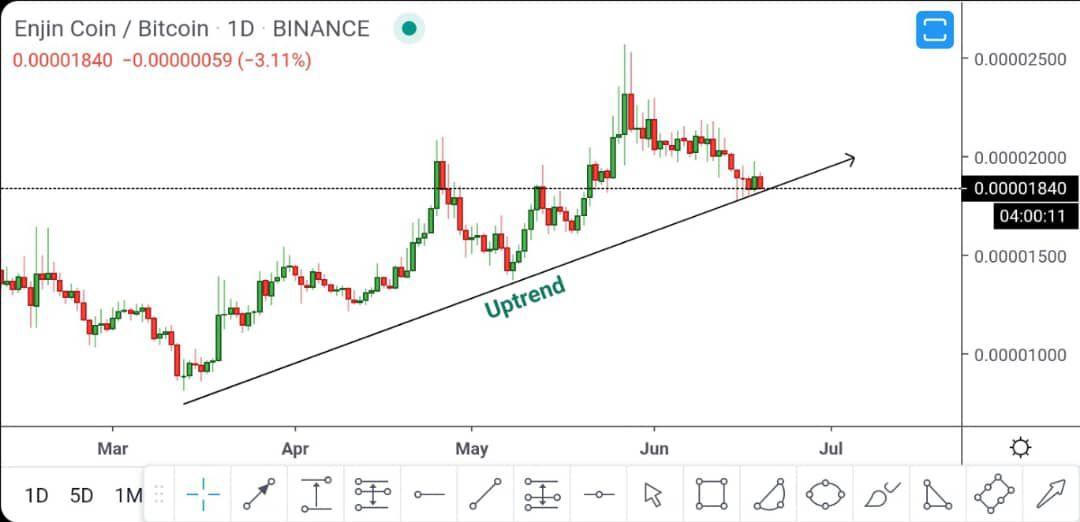
- Uptrending (It is increasing): It means the price of a particular asset /instrument ( Like Pepsi) is increasing and continues moving higher showing little or no sign of stopping anytime soon.
Now let's imagine someone is running on a field until something stops the runner, he/she won't stop but while running there will surely be times when the runner will get tired and the speed will decrease. Yes that's the part where you see red Candlestick in between green Candlesticks that keeps moving up in that chart.
Write this down in your book: In Technical Analysis no asset or instrument (for example Pepsi) moves completely in a straight direction without any sign of rest. Signs of rest will always be visible one way or the other.
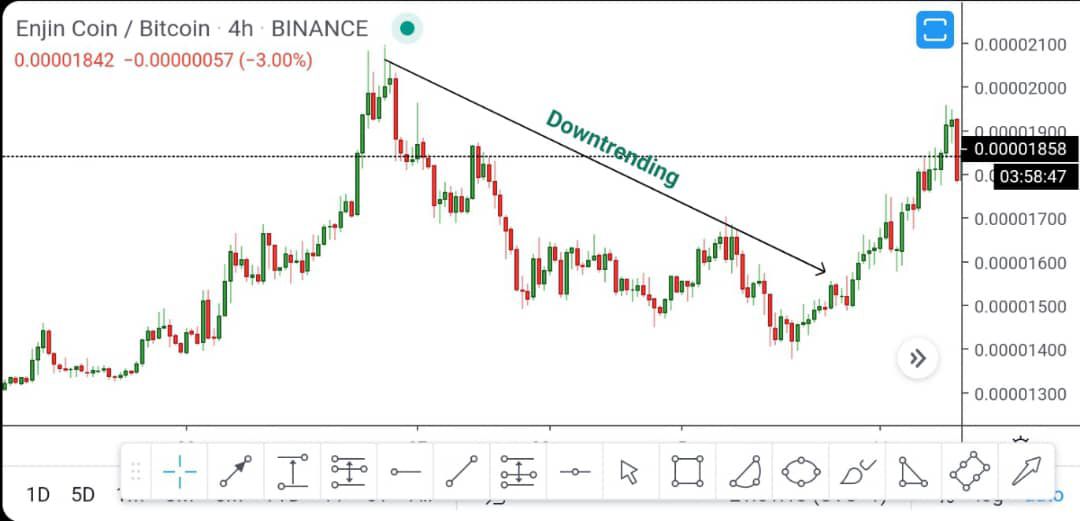
- Downtrending (It is decreasing) : This consists mostly of red Candlesticks as price keeps going down with slight signs of green candles showing in between to show points of reversal before price keeps going in the direction.
If you've ever seen a car race before then you must understand this, if you look at the cars racing you'll see them as very fast and to you it will look like they are running at their top speed without slowing down at all but in reality if you are chanced to seat beside the driver then you will see that there are times when the driver will quickly press the brake when he wants to make a sharp turning.
That is exactly what green Candlesticks stand for in a downtrending market that has a lot of red Candlesticks going down in it. The times when the driver slows down can also be seen if the video of the race is played in slow motion too.
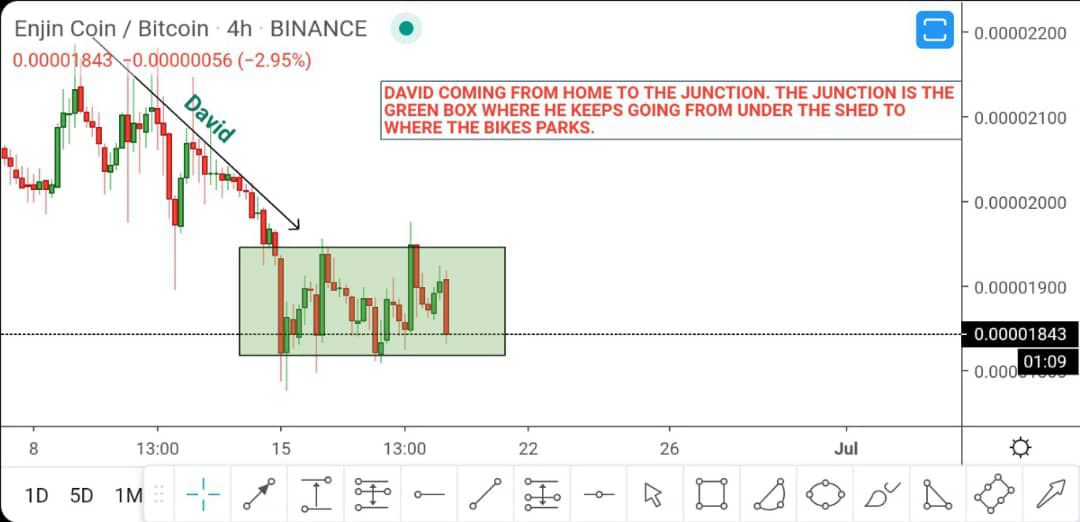
3)Range / Consolidation ( Moving Sideways) : It's raining and David ( A fictional character) leaves home to go to the market to get some things for the weekend. David lives in a very quiet environment where he has to walk to the junction before he can find a bike.
When David gets to the junction he keeps waiving down bikes and continues pricing them mercilessly, while he was doing this he kept walking up and down as he has to leave the shed that is protecting him from the rain and move closer to the bike man so they can negotiate.
While he is doing this, if you notice his movement from his house to the junction was full of green Candlesticks(Uptrending) as he kept moving forward while red Candlesticks (Downtrending) appeared in between whenever he slowed down on the road.
Now when he gets to the junction he keeps maintaining his movement from the shed that is protecting him from the rain and goes to where the bikes parks , negotiates with the bike man and goes back to his shed. This is what is called Ranging and consolidation I.e he was maintaining a movement (from the shed to where the bikes parks) until he finally finds one that will take him to his desired location.
The movement to and fro without going in a significant direction is what is called Ranging and Consolidation. If I continue from here there is a high chance my phone will hang and stop working. We'll stop here for today. Next week Friday we'll be going on into the different types of Candlesticks, what they mean and how they can used to your advantage.
I'll appreciate it if you drop comments and ask questions. Send them all in. I'll answer them all. Thanks for attending Today's class. I hope I was able to convince and not confuse you.
Expect more of this. Follow me so as not to miss any of it. Thanks once again.
❤️💐
Well explained
Thanks nathan
This can be frustrating many times. Great explanation.
Thanks Turpsy
You have a nice way of explaining things. Easy to understand. Thanks!
Thanks. I'll really appreciate a follow.
Interesting!!
Thanks boss
Sweet tutorial. I'm your number one student like this
😁I won't disappoint. Which part of the class stood out to you?