Today is great day. We saw Bitcoin price above 100K. It is first time. I shared lots of analysis and said it is important level for Bitcoin. After Breaking 100K USD, lots of news released for Bitcoin. The new hype installed for Bitcoin.
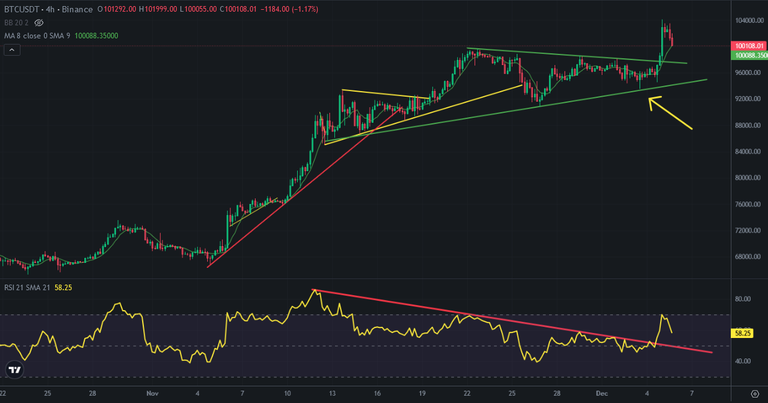
Here you can see 4-hour chart of Bitcoin. I shared this pattern two days ago. I said, it is more possible to see Bitcoin price breaking up flag pattern. Bitcoin price entered new pattern. I will shared new analysis about this.
Here you can see downtrend on RSI Indicator. Bitcoin broke up this resistance. This is why Bitcoin broke up 100K USD.
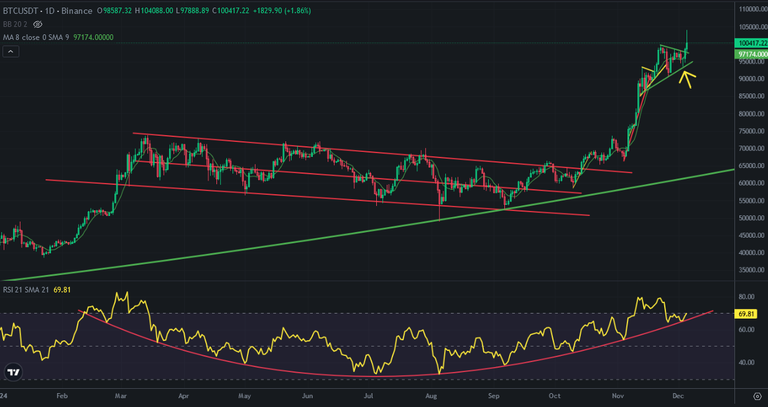
Here you can see daily chart of Bitcoin. There is great bowl pattern on Bitcoin price chart. I shared this pattern a few weeks ago. Bitcoin touched and reversed and broke up 100K USD. It may be last touch on RSI bowl pattern.
We should be careful about Bowl pattern and We should follow RSI Indicator and this pattern. I think what Bitcoin will break up until Christmas. We will see huge price correction on Bitcoin in this month!
End of pattern will be end of this month. As I said, we should be careful.
We will see..
Posted Using InLeo Alpha


This bowl pattern is new to me, quite interesting. I find it so fascinating how we all look at the same chart yet every one sees different patterns. I just posted my analysis on how I see it in the next few days.
Check it out here: https://hive.blog/hive-167922/@stanandrew/btc-to-usd100k-what-s-next