Here is a small love project of mine for the Hive ecosystem: hbdstats.com. A simple and intuitive dashboard designed to help you monitor the vital information related to HBD.
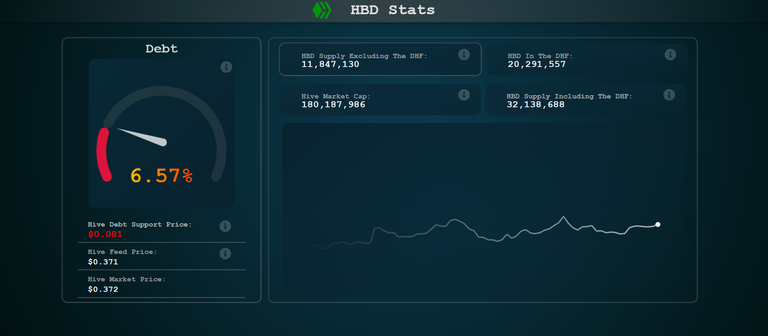
As HBD gains more and more popularity I wanted to build a small dashboard for tracking the important data for the status and the health of HBD in real-time. The main focus for now is the debt level and the Hive support price for HBD.
As we know HBD has to so called haircut rule, when if too much HBD is in circulation HBD is no more valued at one dollar. There is already one site that track this https://hive.ausbit.dev/hbd from @ausbitbank but why not have another one in the spirit of decentralization 😊.
For now, this dashboard covers the following:
- Current Debt Value
- Hive Debt Support Price: The price of HIVE that supports the current HBD supply in circulation)
- HIVE feed and market price
- HBD supply excluding the HBD in the DHF (used for debt calculation)
- Total HBD supply (including the HBD in the DHF)
- Hive market cap used for debt calculations (calculated from the HIVE virtual supply and the feed price)
- Chart for the Hive debt trend in the last seven months
More to come.
Simplicity and Ease of Use
When creating this tool, I wanted it to be simple and elegant. It is a simple tracker but even with this low amount of data to track things can get confusing fast bearing in mind the complexity of the system.
I have striped away a lot of unnecessary things.
There is no text, and all the additional info is in the tooltip (i) icons, if anyone wants to read some more.
The chart for the debt trend has no axes value or data points, but again if you want more info, you just need to hover over the line and it will show the date and the value of the debt at that time.
Speedometer Chart
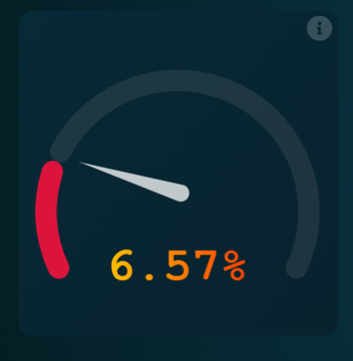
This chart was a challenge to make since I’m using the free and open source chart.js library for charting. It is an elegant but simple library offering the basic charts. The speedometer is not native to the library, so I had to custom make it from a doughnut chart.
The needle in the middle was especially challenging but I managed to pull it off with a custom plugin that draws it and adjusts its rotation to the current value for the debt.
The doughnut is also cut off, and the scales are adjusted from 0% to 30%.
The value for the debt in the middle is also customized, as there is no native value that the doughnut chart places in the middle of it. Some colorized styling was added as well.
Here is some initial iteration of it 😊.
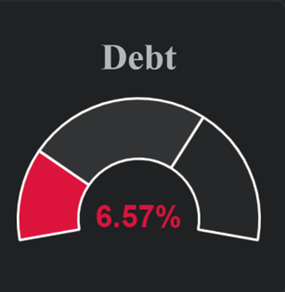
As mentioned, the free charting library that I’m using doesn’t have the speedometer as a default chart. There are some of the other charting libraries like Highcharts that have this built in, but the subscriptions there goes to a couple of hundreds of dollars per month. As a scrapy Hiver I have done my best to come close to that experience and offer it to hivers for free 😊.
Tooltips for Additional Info
All the extra info for the data points is available in the tooltips and shows up when you hover over them.
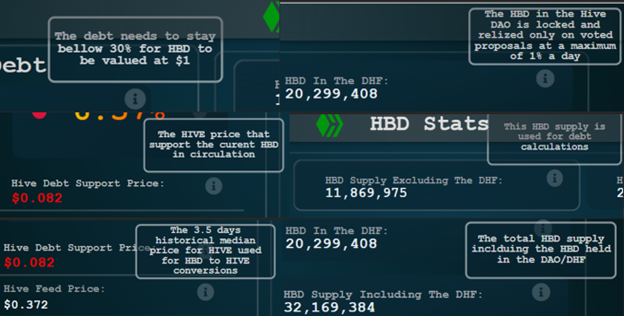
To provide relevant information without overwhelming the interface, HBDSTATS.COM utilizes tooltips. Hovering over data points reveals additional details, striking a balance between simplicity and accessibility.
Line Chart for The Debt Historical Values
This line chart is totally striped of any additional data then the line itself. It is also a bit stylized.
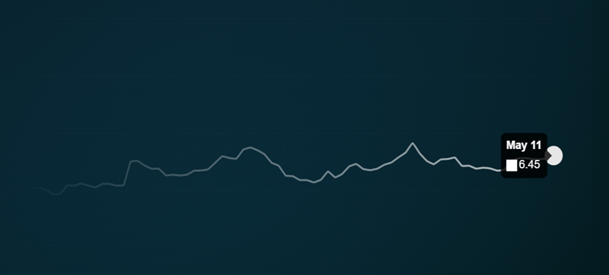
Again, the info for the historical debt is available when hovering over the line.
Mobile Responsive
Since everyone is mostly on their mobile, I have tried to make the tool mobile responsive.
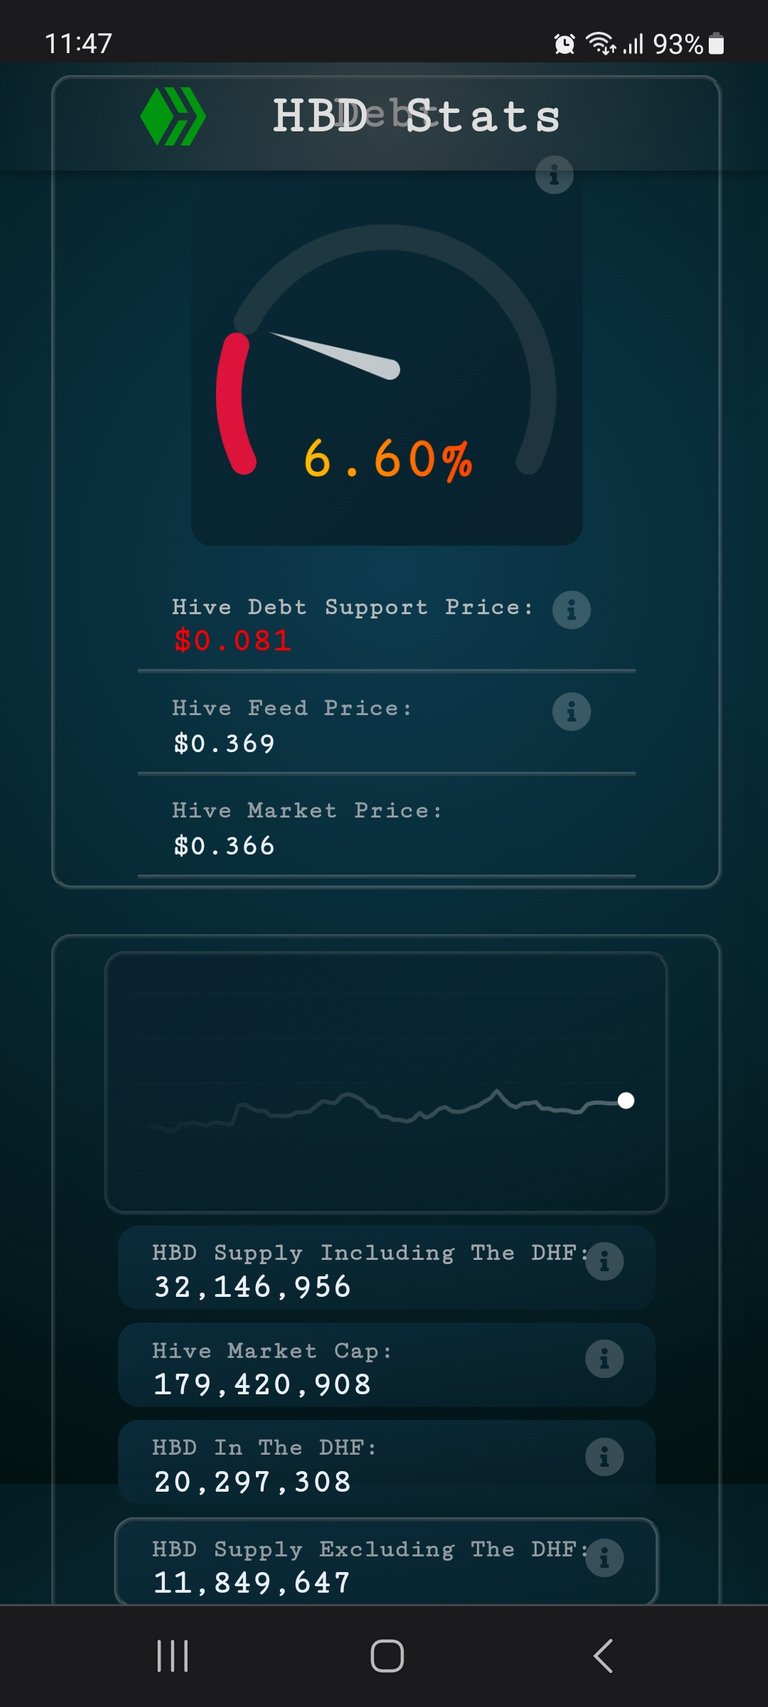
The elements are stacked vertically, and easily accessible with scrolling.
More to come
This is the first iteration for the dashboard, and I plan adding more features like:
- Chart with historical values for the HBD supply
- Chart for the HBD in the DHF and the total HBD supply
- Data and chart for the HBD in savings
- Top HBD holders
- etc
I hope you find this useful!
Any suggestions for improvements and more features are highly appreciated.
All the best
@dalz
The Hive Support Price and the Debt Ratio are actually lower than what the site shows. I suppose that the calculation is using the current Virtual Supply. However, the virtual supply does not account for all of the HIVE that is in reserve to support the price of HBD (and it is not shown in any block explorer).
To get an accurate reading of those metrics that "extra" HIVE needs to be calculated. First, the total potential supply is obtained by dividing the HIVE supply by 0.7. The difference between the potential and the actual supply gives the actual amount of HIVE that supports the price of HBD.
To complicate matters, the virtual supply that is shown on any block explorer is counting the balances in the DHF (and they should not be used to estimate the health of HBD). That is another reason to use a different method to calculate the debt ratio and the support price.
With the potential supply method, we get a support price of around 0.69 and a debt ratio of about 5.71% (as of yesterday).
Yes the virtual supply is used.
Can you point out to the gitlab Hive code that shows that the potential supply is used, and the method that you describe for the calculations.
It is not that the potential supply is used in the code. In fact, it is not. The existence of the potential supply is a logical conclusion or effect of the limit on the debt ratio.
The potential supply is the maximum that the HIVE supply can grow in the event that all of the circulating HBD is converted at the same time.
Even though it is not tracked or mentioned explicitly, it nonetheless exists.
Before the last hard fork, the virtual supply represented the total supply of HIVE that could come into existence if all of the HBD was converted at the same time and it could not grow beyond the limit set by the debt ceiling. However, after the last change in the code, the amounts in the DHF do not count toward the debt limit but they are included in the virtual supply.
For that last reason, the virtual supply no longer represents the maximum that the HIVE supply can grow if all of the HBD are converted. Instead, it only serves as the base used to calculate how much HIVE and/or HBD is emitted on any given day. And. the virtual supply can actually be higher than the potential supply.
If the virtual supply includes the balance in the DHF then it is not a good measure of the true debt ratio. This could be fixed if we do not include the HBD balance in the DHF in the virtual supply but that requires a code change.
I think I understand what you are pointing out, but just to be clear:
The HIVE and the HBD in the DHF are included in the virtual HIVE supply, used to calculate the marketcap as a denominator
The HBD in the DHF is not used in debt calucaltion as HBD supply (numerator)
You are sugesting to exclude the HBD supply in the DHF from the virtual HIVE supply, and calculate the debt in that way?
No, the debt limit gives us the maximum collateral that could be used to back up the value of HBD. Currently, the Hive supply is around 399 million, given the 30% debt limit that amounts to 171 million HIVE.
The true debt ratio is equal to the circulating HBD (denominated in HIVE at the feed price) divided by the potential supply which is equal to the current supply divided by 0.7 (1 minus the debt limit).
The change I would like to see is to exclude the HBD in the DHF from the virtual supply since it is not even currently counted for the debt ratio. It doesn't make sense to me that we left that piece of the code unchanged. It's like comparing apples to oranges.
The rewards earned on this comment will go directly to the people ( guurry123, alokkumar121, seckorama ) sharing the post on LeoThreads,LikeTu,dBuzz.https://leofinance.io/threads/view/guurry123/re-guurry123-2jsjhw4u https://leofinance.io/threads/view/alokkumar121/re-leothreads-259rx65kx https://leofinance.io/threads/view/seckorama/re-leothreads-2pymrhjcf
Cool, you decided to go all the way and put this out. Refreshing.
Thanks!
I have been hammering the HBD data for a while now, so this helps in that direction.
I see, pretty good job! How many pages did you launch prior to this one?
You can say almost none ... just WordPress blogs
That means you struggled though the whole process to put this out. Impressive.
Great tool, the most amazing part is how good the visualization often lacks on Hive. Great job 👏.
Having nice visuals was a priority :)
As it should be.
I like its simplicity. Well done, @dalz!
I have a question: why have you chosen to use a red gradient for the low debt ratio? I thought maybe it's more intuitive to start from blue (cold) and go to red (hot) when the debt ratio gets close to the 30% limit.
The choice was to show its importance. But yea, starting with green and going to red is better. This way it looks scary from the very beginning :)
Will put it on the to do list.
Yep, that's what I was thinking. :)
awesome, also wanted to ask for something similar :)
Can you add the hive price chart with the debt chart? That will help users to see the effect of hive prices on debt.
Something similar to the below picture.
Thats interesting ... might add it in some future upgrades
Sometimes all you need is a good info graphic like this for it to all make sense.
I'm pretty sure I just did a homer 'oooOOOOoo' when I saw this post on my feed. Website looks super slick!
Congratulations, it looks awesome.Super cool website @dalz!
The amount of HBD in savings is an essential features in my opinion.
Its coming :)
I love the color combination, it's simplicity and being mobile friendly. It will be very useful. Great work :)
Good one @dalz. Love it!!!!
Tnx!
This really makes a lot of sense. Simple and user friendly
It's a much-needed tool to monitor HBD stat in real-time.
Just having a doubt--
Does it mean as long as Hive trades above $0.081, Blockchain will continue to print HBD?
As the tooltip says it is for the current HBD in circulation, or around 11.8M HBD. If the amount of HBD in circulation increases, says it goes to 20M HBD, so will this price, and the opposite, when HBD supply drops so does the price.
Great front end Dalz. That is pretty slick but simple and easy to use.
Tnx!
Scrappy Hivers ftw! ✊
I'm pretty sure, people are going to use it and love it. You have done a great job @dalz. There are some people including you who are doing great for #hive project and we all should appreciate you for your efforts.
Nice!!!
very nice :)
Thanks. It's easy and simple to use.
Very nice tool! I like!
Excelent!
This is really cool. A great tool you have made here
awesome! thanks!
;)
Awesome. :)
When I visit the site with www. in front, it shows a certificate error.
Thanks for the feedback. I'll check it out.
Nice
Great tool. I need more HBD
Awesome update and it is really nice to know about this and thanks for sharing.
Great this is a great help.
!ALIVE
You Are Alive so I just staked 0.1 $ALIVE(3/10)@dalz! to your account on behalf of @tokutaro22.
The tip has been paid for by the We Are Alive Tribe
 through the earnings on @alive.chat, feel free to swing by our daily chat any time you want.
Wow dalz. Nice work
This is a really nice feature, especially for those of us who are not well versed on the underlying technical aspects of how Hive works!
The rewards earned on this comment will go directly to the people sharing the post on Reddit as long as they are registered with @poshtoken. Sign up at https://hiveposh.com.https://reddit.com/r/CryptoCurrency/comments/13ii40q/introducing_hbdstatscom_a_simple_and_easy_way_to/
Thanks for the dashboard!
How did you build it? What's running in the backend?
!PIZZA
All the data is pulled directly from hive api.
$PIZZA slices delivered:
(1/10)
kuhnchun tipped dalz @darkflame tipped @dalz
I wonder how you were able to go about the dashboard
That is very nice
Thanks for the information too!!!
This is great!! Thank you!!! !PIZZA
Awesome ❤️
As always, thanks for the service.
Congratulations @dalz! You have completed the following achievement on the Hive blockchain And have been rewarded with New badge(s)
<table><tr><td><img src="https://images.hive.blog/60x70/http://hivebuzz.me/@dalz/payout.png?202305160454" /><td>You received more than 45000 HP as payout for your posts, comments and curation.<br />Your next payout target is 46000 HP.<br /><sub>The unit is Hive Power equivalent because post and comment rewards can be split into HP and HBD <p dir="auto"><sub><em>You can view your badges on <a href="https://hivebuzz.me/@dalz" target="_blank" rel="noreferrer noopener" title="This link will take you away from hive.blog" class="external_link">your board and compare yourself to others in the <a href="https://hivebuzz.me/ranking" target="_blank" rel="noreferrer noopener" title="This link will take you away from hive.blog" class="external_link">Ranking<br /> <sub><em>If you no longer want to receive notifications, reply to this comment with the word <code>STOP <p dir="auto">To support your work, I also upvoted your post! <p dir="auto"><strong>Check out our last posts: <table><tr><td><a href="/hive-122221/@hivebuzz/lpud-202305"><img src="https://images.hive.blog/64x128/https://i.imgur.com/pVZi2Md.png" /><td><a href="/hive-122221/@hivebuzz/lpud-202305">LEO Power Up Day - May 15, 2023<tr><td><a href="/hive-139531/@hivebuzz/proposal-2324"><img src="https://images.hive.blog/64x128/https://i.imgur.com/RNIZ1N6.png" /><td><a href="/hive-139531/@hivebuzz/proposal-2324">The Hive Gamification ProposalNew ideas and creativity at its peak. Congrats buddy.
me gusto mucho esa herramienta,pero me gustaría también que fuera en español para tener una mejor interpretación...
Now it will be much easier to talk about the hbd beast.
I suggest one more feature which is not need but I wanna see. Maybe here or redirect me to somewhere where I can see HBD in staking rich list with my rank too. This will gamify my stacking journey. :)
As it is very important for anyone working on this project to know about all these things, the way you have told us about the tool will be of great benefit to all of us. Also can see and can also see the rest of the supply etc. You're doing a great job on hive. Every time I read your post, there's a great knowledge.
This is so cool! Wherever I post about HBD - it'll help me a lot 😃
This is indeed a great tool. Simple yet powerful. This will really go a long way to helping many hivers. Kudos to you.
Simple data, easy to see at a glance. Thank you!
Could you explain what exactly the support price is? Is that essentially the price hive can drop to before the current supply of HBD would not be worth $1?
yes
Gracias por tu publicacion y disculpa las molestias causadas, no entiendo si yo no ando haciendo nada malicioso... Que decepción.. pero gracias ...
Codigo de twitter publish.... hecho por twitter... ningun spam, ni nada hecho con mala intencion 😒