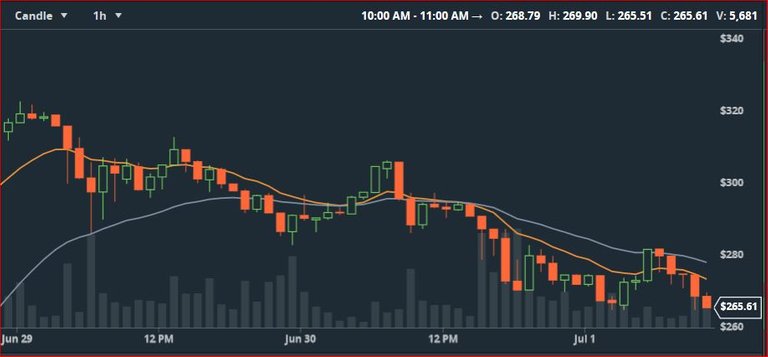
You can see ETH has been trending down a solid 48 hours. Its taking a while to go down, but on the hour chart, you can see its obviously going down consistently.
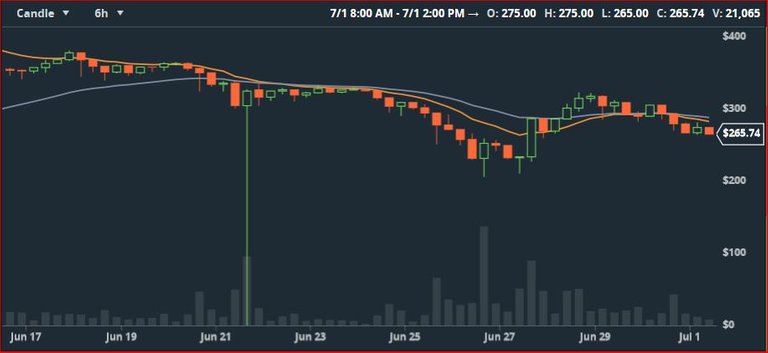
The 6 hour chart, you can see the best support was at the $232 mark on June 27th, just after the first crash.
Im betting ETH is headed for the strongest resistance at $232, if it goes below $232, the strongest support was at $87.
IF...it goes to $87, one has to question how valid ETH is at all after reaching $413.
ETH and BTC are so incredibly volatile. If you're looking to invest in something where you want to retain your investment, LTC is it. When ETH and BTC are swinging $50 here $100 there, LTC is swinging 30-50 cents. Thats pretty consistent.


Too many ICOs are sitting on ETH, aren't they? They may be the cause of the collapse, but it MUST rebound before they dump it. I don't see it collapsing before opportunities arise for these companies to cash out, however small a window...
Thats supposedly why theres been the drop, all the ICO's.
It could easily go down to the low $200 area. I don't think it will go down below that.
We shall see, at this rate, who knows.
I think we're starting the beginning of a symetrical triangle, next bottom i agree is 233ish, maybe 250 but these bulls aint loyal
At $257 now, Id hate to miss the bottom, but Id feel really dumb holding at $250 and it plummeting under $200.