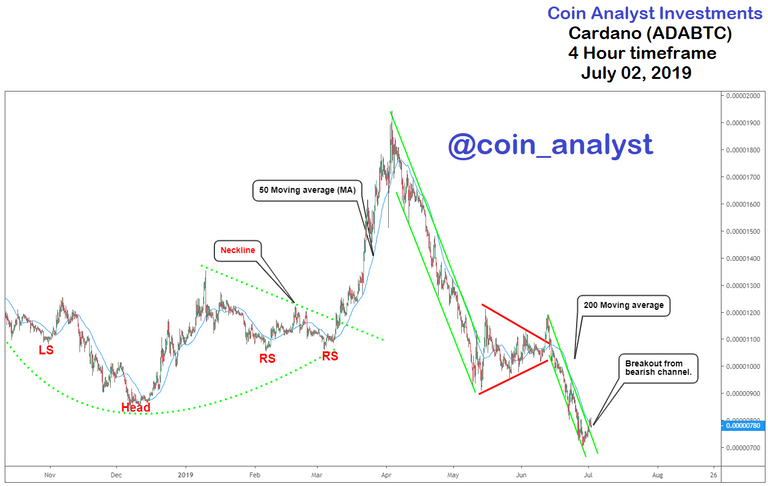
Conclusion for today’s Cardano technical analysis: Price breaking to the upside of the 4 hour timeframe bearish channel supports a bullish bias and higher Cardano price.
Cardano chart analysis for today is carried out on the 4 hour timeframe with focus the chart patterns identified that are crucial for future price development. October 15, 2018 to current date is covered for price action which includes the previous head and shoulders bottom that was accurately forecast.
Read post here (https://coinanalyst.investments/2019/03/21/ada-analysis/)
Instagram: https://www.instagram.com/coin_analyst/
Twitter: https://twitter.com/Cryptotrader029

Cardano upon confirming the complex head and shoulders bottom (or inverted, complex head and shoulders) pattern reach a peak of 0.00001944 on April 03, 2019. This was followed by the current bearish swing that saw Cardano price close at 0.00000703 on June 28, 2019.
The use of a bearish channels helps to put the first and second leg of the bearish swing in perspective with price successfully breaking to the upside of the channel as indicated on the chart. Besides, a bullish bias is also provided by the breakout closing above the 4 hour timeframe 50 moving average.
A crossover of the 50 moving average above the 200 moving average and price will provide even higher probability of termination of the current downtrend. Price action closing below the June 28, 2019 low of 0.00000703 as opposed to continuation of the bullish move invalidates this analysis.
Our previous Bitcoin analysis (BTCUSD) before the current price rally was also posted for FREE and can be found below.
https://coinanalyst.investments/2019/04/26/btc-analysis