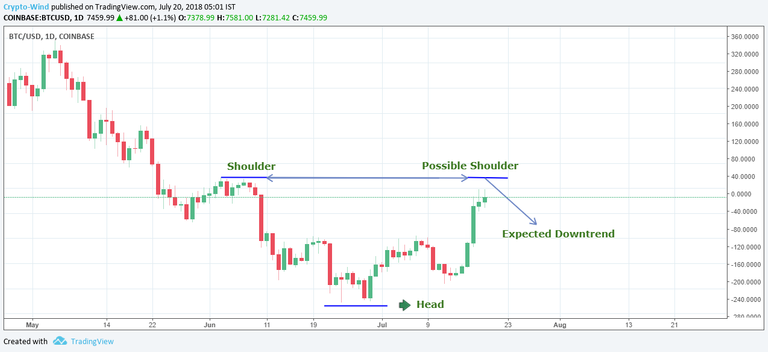
Last day I had predicted that after forming an inverse head and a possible shoulder chart pattern BTC price might experience a downward trend.
BTC is now trading around 7350$ after facing resistance at 7700$.

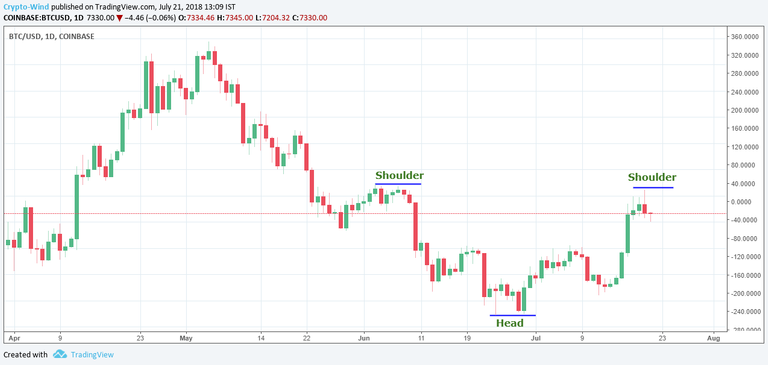
As you can see BTC chart pattern already has formed an inverse head and shoulder pattern. You can see how a downward trend is ongoing.

I have found a support level for it. The first support is at 7000$ that I have early mentioned. I think this support level is hard to break for some couple of days.

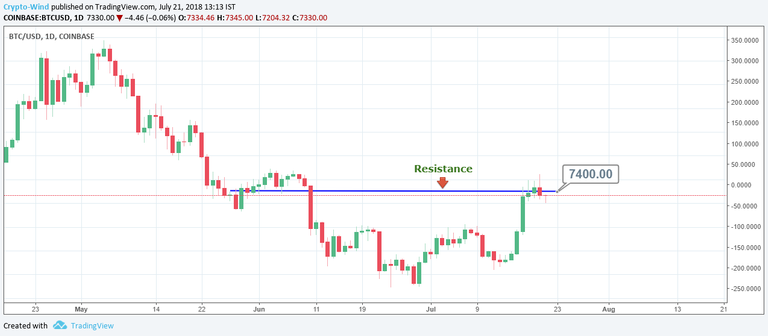
BTC is now facing resistance at 7400$. There is a big chance we will break this resistance and head up to 7700$, this is because we cooled off and ready for a new run up!

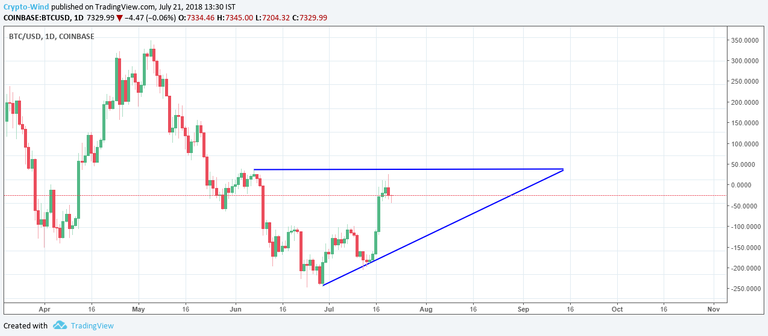
Another possibility is that we may have to wait for some couple of days to form an ascending triangle chart pattern for a bullish movement. In the meantime, we will experience little ups and down in the price movement as you can see it from the image. After that, I firmly believe an upward trend will be experienced.
We got some questions about why bitcoin price is bumping more and alts are not. The only answer is that in the past we have seen the same thing, first bitcoin dominance rises and alts follow after that. This is why I prefer to predict bitcoin price over alts.
You can also check my previous ideaHere!
Disclaimer: Everything written here is for discussion purpose only and should not be taken as advice to invest your capital. Always Speak with a professional financial planner or advisor before making any investment decision. Never make a trade based on what you see here. Your capital may be at risk for cryptocurrency trading.
Stay tuned with my update to get your coin market condition and keep supporting me.
Sort: Trending