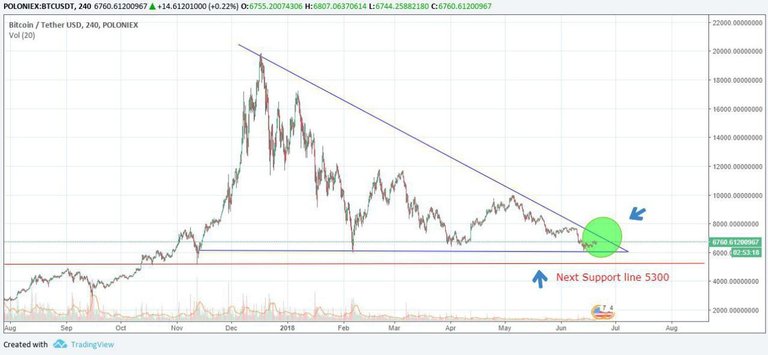
IN this BTC chart ( 1 day frame)
First, let's look at trends. Due to the rise of the market, it seemed to be challenging to break the upward trend of the long-term trend line, but it seems that it failed due to the drop of the morning today.
Today, BTC has gone dumped to $ 6,550 with the Bithumb FUD, about $ 200. Since then it has been supported by the $ 6600 and now stands at $ 6600-6650.
Once the long-term trend line has risen, it can not be seen that it has entered the upward trend, and the trend line is now about $ 7,200.
Let's take a look at the following pattern. Next expected target 7100, it seems that only the neck line can be supported. You can find the pattern of disassembly flag on the basis of the 4th hour of the loops. at least $ 7200 should be borne in order to make a certain transition, and you must support at least $ 6,620 as a base rate. The $ 6620 is the lowest point of February. There is no support line under there, so you can go under $ 6300 / $ 6100 as well.