
BTCUSD
We are analyzing bitcoin again because, well, that is where all the action is:
After our call to go long on a break of the bull flag $6240 BTC ran all the way into the $7300's before printing a reversal candlestick and forming what is known as a blow-off top. This is a perfect example of where walking up a stop loss would have allowed you to lock in most of those gains and then cleared the position that you may re-evaluate. A number one rule for me is to always respect my stop loss.
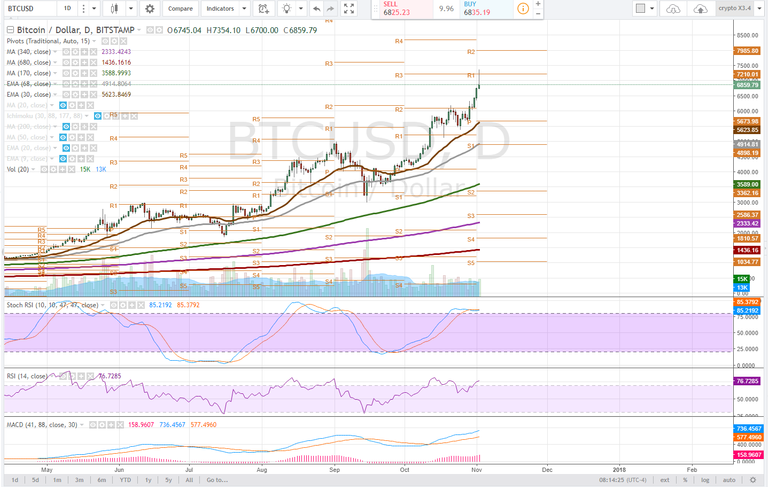
Daily
The daily time frame is forming what is known as a reversal candlestick - the price hit $7354 before a sharp pullback to as low as $6700. This would have been selling into strength that suddenly resulted in demand waning and an oversupply. A steep pullback like that and reversal candlestick are indicative of a top, shorter and longer term. Top confirmation on the daily time frame will require a follow up bearish candlestick.
The stochastic RSI while it still looks like it could maintain uptrend, could begin to revert as the RSI has entered overbought status as well the MACD is far above zero line on this time frame. Bulls should be cautious as the bears are going to get very hungry.
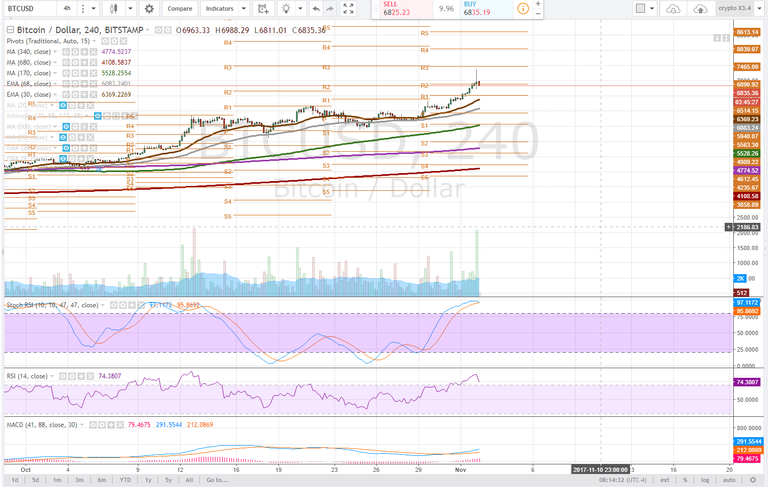
4 hour
On the 4 hour timeframe, the blow-off top is more easily observed and is currently being confirmed by a follow up red candlestick. The price is testing pivot R2 ($6890) as support. Losing this level would turn it into resistance and indicate that there is massive supply in this zone.
The curl in the stochastic RSI and impending bearish cross look to indicate a steep pullback in price. It is following the curvature of the RSI which is coming down quickly from an extremely overbought status.
If the price cannot maintain this level, bulls will look to pivot R1 ($6514) to provide price support, failing that the next levels of support on this time frame are the 30ema and 68ema.
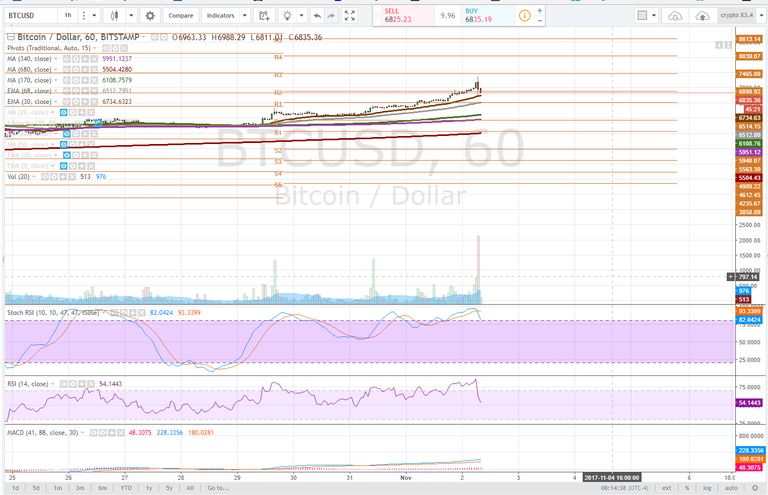
1 hour
On the 1 hour time frame we are observing similar to the 4 hour, with the RSI falling sharply which has caused the Stochastic RSI to deliver a bearish cross where it looks to fall out of uptrend. Waning bullish momentum is indicated by the stochastic and rate at which the RSI has dropped.
The price found support on the 30ema, and it will be critical to hold this level, if the price fails to do so, look to each subsequent moving average for support. It is also prudent to draw out the fibbonacci levels. Cryptocurrencies tend to love the 61.8% retrace.
Bullish Above: $7200
Bearish Below: $6890
RISK TRADE: Very risky would be to short here. Tight stop losses and a careful eye. Alternative trade would be looking to ALT coins priced in BTC.
Don't forget to use stop losses!!!
Previous Articles:
BCHUSD
ZECUSD
LTCUSD
BTCUSD
ETHUSD
BTCUSD
LTCUSD
XMRUSD
Follow at your own risk, Not a financial adviser, understand the risks associated with trading and investing. Manage your own Risk - in other words you could lose it all and it's your own fault.

Excellent analysis. thank you
Upvoted and RESTEEMED :)
Satchmo, good analysis.
Nicw
My alt coins look like a damn blood bath
yea...people dumping altcoins and go to buy BTC..
I don't think that's a good sign, it doesn't look sustaining.
see the price comparison chart here: https://steemit.com/bitcoin/@hoball/btc-usd-is-now-in-bubble-mode-watch-out
good luck to you , good luck to everyone who has the bitcoin !
Great analysis :D