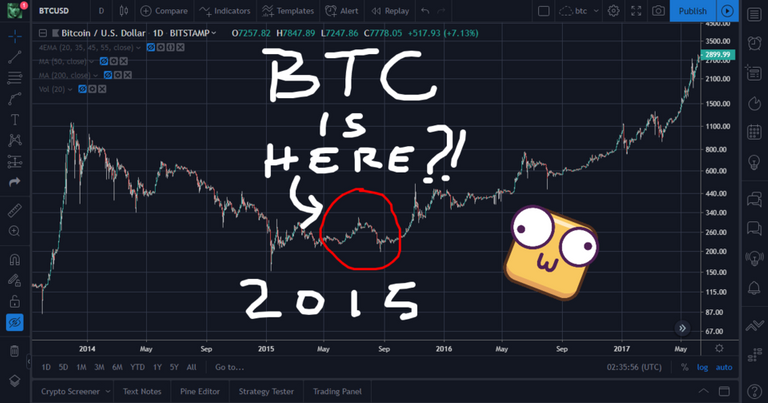
This was back in the bear market of 2015
This is now...see the similarities?
Let's take a closer look and watch this numbers...
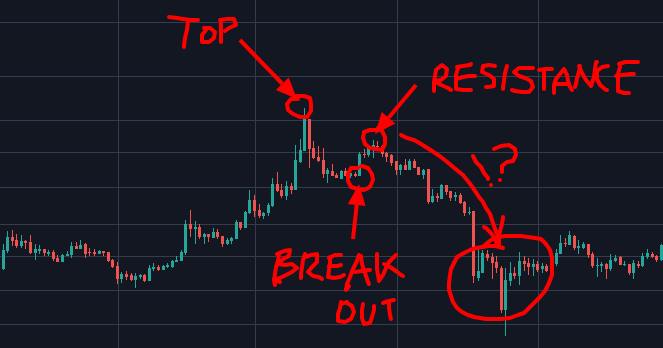
The ratio between the resistance and top is:
297/317= 0.9369
then I multiplied that ratio with the present high of 8390 to get the present resistance level
8390 x 0.9369 = 7860
I drew a line on the 7860 and surprisingly enough the chart respected it as you can see...until now at least
So now let's confirm the breakout point too of 275 and see if it matches, again:
275/317 = 0.8675
now for confirmation:
0.8675 x 8390 = 7278 <----- Success! Which is pretty damn close enough to the present breakout around 7300


