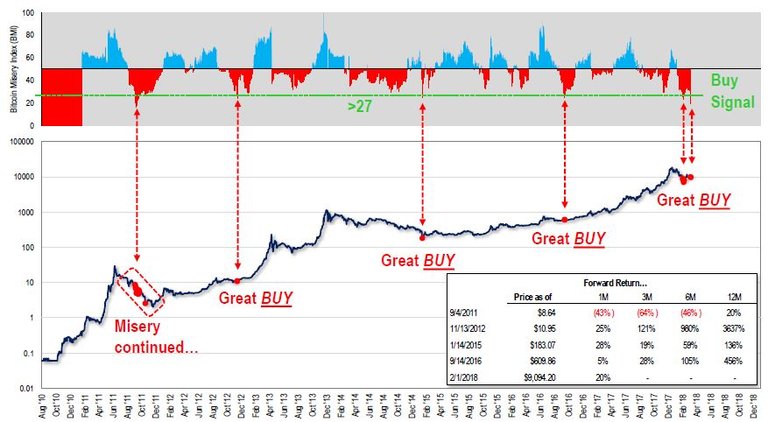
This Index is the most accurate tool I have seen for predicting positive 12 month gains or more. Currently at 18, which suggest a flashing buy signal currently. The lowest on record was 11 when Bitcoin dropped from $32 to $2 in 2011. Ouch! But that was best time to buy when bullish sentiment was at all time lows.

This Index was developed by CFA Analyst Tom Lee of Fundstrat. He has a $25,000 price target on Bitcoin since last summer and has correctly called many markets well in advance.
I once heard him speak at a Miami CFA meeting mostly about oil commodity in early 2016 when oil was crashing around $25 a barrel. He pulled out tons of charts and data to suggest oil would recover much higher from then, which is has now to around $60 $70 a barrel. Oil stocks have performed great since then.
Contrarian indicators such as this are what I believe the smart money looks at. I past being contrarian has helped me make the right investment decisions but turn arounds don't happen over night so I found its best to be patient.
I hope this helps cool down some of the fear out there. By next fall the Cryptos will likely look very positive from these levels here and have made new highs again. Investors at least have a much better chance to make good gains now that we have seen big price corrections. Valuations are much cheaper than a few months ago and outlook has never been brighter. The only that's changed is cheap prices and who does not love to go shopping your favorite brands at 50-80% off?!
I wonder why someone has sold so much yesterday. But probably we will never find out what the reason was...
@hedge-x Agreed, contrarian indicators are good ... for critical thinkers. Most people dont have enough to short crypto using futures. Wonder if there will be an ETF for this misery index soon...
IDK but that would be a perfect index to invest in b/c the performance would be killer. Maybe I will be the first Analyst to start one. Let me know if you find it. Thanks.
well i am learning from your and other post something about crypto and soon i will learn about these up and down graps!
I can't understand these graphs because i don't know much about crypto :)but i hope bitcoin will rise to peak
To make it simple Crypto investors need to buy or sell when Index reaches extreme in either direction, with 100 being the peak bullishness and 0 being peak fear, uncertainty and doubt. This index has shown extremely positive returns for investors within 12 months from past. In fact, all the biggest returns in Crypto have come after market crashes. It just makes sense but most retail investors will continue to buy high and sell low.
first of all thanks for explaining and i understood your points but the experience will come through trading i think.I have read alot of articles about crypto just in a process of learning.
And i have to make these types of graphs for energy modelling in my research :)
According to the index any time under 27 is a buy. Currently, we are around 18. Index suggest a very strong buy area here based upon sentiment and human emotions mostly. Or this one sounds kinda mean but so true. It's the transfer of wealth from the dumb money to smart.
Where do you find this tool itself? Is it applicable to other coins?
For now its just tracking Bitcoin but I expect as the space keeps maturing over next year, they would add a total crypto index. Remember last year this time BTC had 85% of market. The markets are changing very fast from quarter to quarter.
great analysis man... amazing information...👍