Bitcoin VS Stocks! (BTC) VS (SPY)
Hi friends!
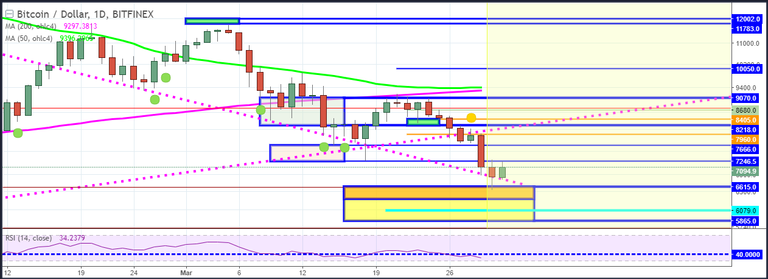
As we pullback from the 6615 resistance level we are looking at two levels of importance. The 7200 level is the level that needs to be broken for us to turn bullish. This level needs to be held. At this point I almost want to see two closes on the 12 hour chart to confirm.

The level I am looking at for a continued decline is the 6427 level. Keep in mind between the 5865 and 6615 level this is an likely area for a reversal so being short here is dangerous.
Regardless of the calls for zero I am not selling here. If you do not believe in the space in general then invest in IBM and TSM as they both have blockchain exposure and pay nice dividends. Personally I believe this is just a typical correction that ALL markets go through. Scared money don't make money! I am actually looking at some alts like WABI and DRGN to add here.
Kon'nichiwa! Welcome eager warriors, to @a-blockchain Rise, like the vengeful conquerors that your are, and discover the very essence of what it means to be a master analyst! The ability rests inside of you all. Hone it! Sharpen it! And unleash it on this unsuspecting market! Are you with me, warriors!? ARE YOU WITH ME!? Then bow to your sensei, and let the training begin! Haaaaai-yah!!
Recently, there has been some debate about the relationship between the stock market and cryptocurrencies — a discussion that many of us have been a part of. Now, it's time to assess the two markets, side by side, to truly understand this relationship. So, in today's lesson, we will cover market comparisons, as we search for elusive technical nuances that can impregnate our trading strategies with unprecedented wisdom. Without further ado, let's assess the the relationship between Bitcoin 3.55% and the stock market, via the S&P 500 1.10% ( SPY 1.28% )!
Before you is the four hour BTC 3.55% chart, with the SPY 1.28% overlapped (in black.) You can see how the SPY 1.28% has made a series of peaks and troughs, during it's ascent to the all time high, in a way that is incredibly similar to BTC 3.55% . On the left side of the chart, there were four primary peaks (blue arcs) that correspond perfectly with one another. From there, we can see that the rallies to the respective all time highs were slightly different. BTC's rally was more parabolic, but there were still some similar subtleties in the peaks and troughs along the way. However, after the all time highs were reached, things got very interesting.

I've taken the liberty of circling each corresponding peak and trough in a different color, to highlight this very clear correlation. Starting from each chart's respective all time high, the circle order is green, red, blue, black, purple, orange, with an extra pink circle on the end of BTC 3.55% . You can see that BTC 3.55% posted the all time high on 12/16, while the SPY 1.28% posted it's all time high on 1/26, more than a month later. From there, each peak and trough continued to be printed by BTC 3.55% before the corresponding peak or trough was formed on the S&P 1.10% . Most recently, Bitcoin 3.55% has fallen dramatically lower, in an move toward a test of it's 2/6 low (red circle.) The current low in BTC 3.55% is circled in pink, but a comparative low hasn't been created yet on the SPY 1.28% chart. So, BTC 3.55% is telling us that we can expect the SPY 1.28% to head lower, in order to form it's new low (future pink circle.)
You may be wondering why this information is valuable. The reason is because it shows that there IS a correlation between the stock market and cryptocurrency prices. Furthermore, it throws cold water on the idea that a falling stock market could generate relief for cryptocurrencies. For that to happen, we would need to see a divergence of this trend, where the two assets would suddenly begin trading in opposite directions. Currently, there is absolutely no technical indication of that, so there is no reason to believe that there will be a significant rotation of money from the stock market into cryptocurrencies. That is extremely valuable information, especially for crypto investors who may be banking on an influx of money from this top heavy stock market. Another reason why this information is enormously valuable, is because it is another bearish indicator on the S&P500 1.10% . If you've seen my recent SPY 1.28% charts, you know that I'm bearish on the stock market. This is another sign that stocks could be set to fall further, and adds even more merit to the short case for stocks. After all, the SPY 1.28% graph needs a pink circle.
Now that you've had a crash course on comparisons, you can use this method of analysis to better understand the relationships between other markets. It is an invaluable tool, for assessing market relationships and occasionally discovering markets that lead others.
I forgot to circle the peaks after orange, but they exist on both charts. =p
TRON — Too Much Sizzurp! (TRX/BTC)

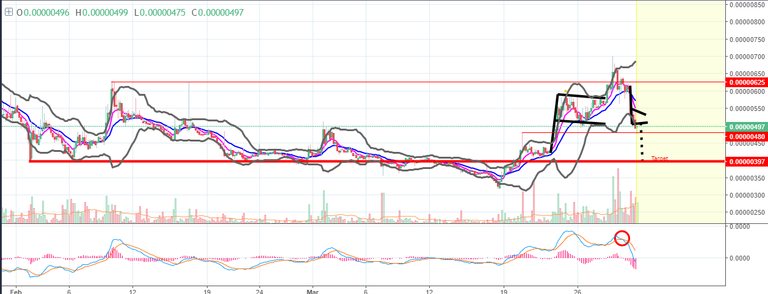
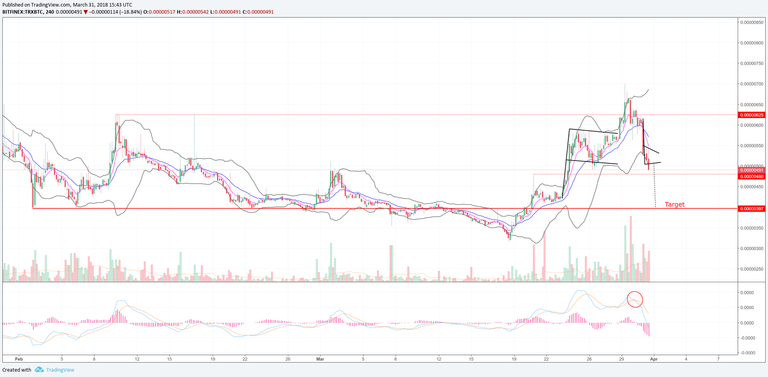
Welcome to this update a nalysis on TRON! Let's get it! Looking at the four hour chart, you can see that TRX/BTC -17.85% has rallied out of the bull flag , but it wasn't able to hold above the overhead resistance at 625. Now, Tron -6.06% has fallen dramatically, forming a bear flag consolidation, as the momentum expands to the downside. You can see that the MACD has just crossed below the zero line, which is a technical sell signal, while Tron -6.06% is printing a bear flag . Volume is declining, which confirms the consolidation inside of the flag. However, the majority of the recent volume has been overwhelmingly red. Furthermore, you can see that the big red reversal bar of 3/29 had very high sell volume associated with it. That's an indication of a major rejection of that level, so we can assume that further downside remains. Additionally, you can see that the candles inside of the flag body itself are very bearish — printing increasingly taller upper wicks. That's an indication of mounting sell-side pressure inside of the bear flag . With all of these negative indications, we can expect a breakdown of the bear flag to occur. Light support exists around 480, with major support around 397, where the downside target rests.*

Ethereum Sets Bridge — #ETH

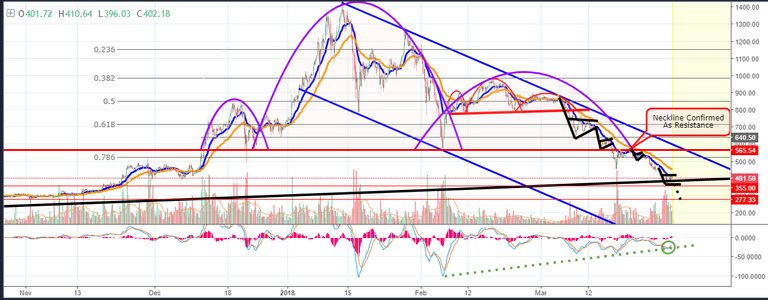
Welcome to this update analysis on Ethereum! Let's get right to it! Looking at the four hour chart, you can see that ETH has continued to fall from the massive head and shoulders breakdown that occurred. Now, it has dropped to the rising black trendline support, and is building a bear flag . You can see that ETH has actually violated the black trendline on several occasions, inside of the body of this bear flag , so we have effectively weakened the black trendline support level . Additionally, you can see that the 20 EMA (in blue) is making it's way into the flab body. As I mentioned in my previous analyses, the 20 EMA has been the catalyst for former bear flag breakdowns, which are still here on my chart. So, clearly there is a pattern of bear flags, that are forced to breakdown by the resistance that is generated by the 20 EMA . There is currently no technical reason to believe that this pattern wont continue. Therefore, as the 20 EMA moves into this bear flag , we can watch for it to become resistive, pushing price action lower for a breakdown. The size of this bear flag , suggests that price could correct to my downside target of 277.33, should a breakdown ensue. A continuation lower is clearly the most logical forward path. However, if a breakout to the upside of the bear flag materializes, that could indicate a more substantial short-term bottom here. Technically, that is currently an unlikely scenario.*
On the MACD , you can see that there has been a bullish crossover, but the bull cross has been formed while price has been in a bearish consolidation. Volume has been on the decline, confirming the bear flag consolidation. Also on the MACD , you can see that a significant bullish divergence is taking place, and the bullish crossover has just occurred right on the rising trendline support of the divergence (green dotted trendline .) However, unless we see a breakout to the upside of this bear flag , those underlying bullish indications are less substantial than the overall picture. Bullish divergences are finicky indicators, and should only be considered when other technical indications confirm the divergence. In this case, it would be a breakout above the bear flag and the 20 EMA . Regardless, the focus is that a break to the downside should occur, carrying ETH down to the support at 277.33.
The Glass Floor Trap Door! LITECOIN! (LTC)

Welcome to this update analysis on Litecoin! Let's get right to it! Looking at the four hour chart, you can see that LTC is forming a large bear flag consolidation, after breaking down from the triangle formation above. As you can see, the 20 EMA (in blue) is passing through the flag body, and it has already proven to be resistive for the past few candles. Overall, this is a very bearish look. We've fallen from a massive triangle formation, we're building a large bear flag , and we're doing it just above the former double bottom level, from the low that was created on 2/6. This is significant, because it could produce a powerful breakdown that could cause LTC to smash straight though the exact double bottom low of 2/6, which would obviously be very bearish . It's like we're coiling up, and harnessing the momentum needed to take out the exact double bottom , in one fell swoop. Imagine that level as a glass floor. We've plummeted toward it, and now we've paused just slightly above. The bear flag is like a hammer that's being lifted, and if it's thrown downward, the odds of a breakdown below the double bottom , when we're this close to it, are definitely increased. If you recall from the last post, I mentioned that the recent low could be the test of double bottom . Technically, double bottoms don't have to be exact. They just have to be within a few percentage points, and the recent low was certainly that. Now that we appear to be gearing up to head lower, it is possible that we could see some sort of a reaction off of the exact 106.52 level, as buy orders could be waiting there for activation.*
Since the 20 EMA is passing through the flag body, we can use it as a gauge of the likelihood of a breakdown of this flag. In other words, if the 20 EMA is surpassed inside of the flag body, it will show that we may see another test of the upside of the top of the flag. If the top of the flag is broken, then it would be negated. However, there is currently no indication of that, so the odds of a breakdown are currently the most likely scenario.
On the MACD , we can see that there has been a bullish crossover, but price is consolidating in this bear flag , so I wouldn't read too much into the bull cross in momentum. Volume is falling, and that confirms the bear flag consolidation.
I've noticed some comments on previous charts from people who claim that I call both sides of the market, particularly when I give formations. Let me be perfectly clear. When I draw a formation on my chart, I'm not drawing it with the expectation that it will fail. Meaning, if I draw a bear flag , there is a certain expectation that it will break down, and that is my primary directional focus. However, I don't usually trade patterns until breakouts occur, because patterns do occasionally fail. Regardless, I always consider the support or resistance in the opposite direction. That's just a normal part of being an analyst. If I ignored the risk in the opposite direction, that would leave us both pretty blind, wouldn't it? So, if you see me draw a pattern, and then talk about levels in the opposite direction, it's not because I EXPECT those levels to be met. I'm just highlighting risk levels, if things move against us. For now, this is a big nasty bear flag , with resistance falling through it. Most likely, we WILL see a breakdown, unless technical evidence emerges to suggest otherwise, like a break above the 20 EMA , and the top of the bear flag . Currently, that evidence doesn't exist. There.
Was that clear enough?
If you are not already on the stock exchange, you can register
#litecoin #ethereum #steemit #analys #analyisis #cryptocurrency #crypto #ltc #btc #trx #tron #bitcoin #arch #blockchain
Sourece by @a-blockchain
Thank you @a-blockchain
thanks
Your Post Has Been Featured on @Resteemable!
Feature any Steemit post using resteemit.com!
How It Works:
1. Take Any Steemit URL
2. Erase
https://3. Type
reGet Featured Instantly & Featured Posts are voted every 2.4hrs
Join the Curation Team Here | Vote Resteemable for Witness
Supper analys thanks
thanks