Hi. I shared a Hive chart on January 2, 2022. You can check it out here. It's time to re-share the Hive/Usdt chart I'm currently following. In today's post, we will examine the price chart in daily and weekly timeframes.
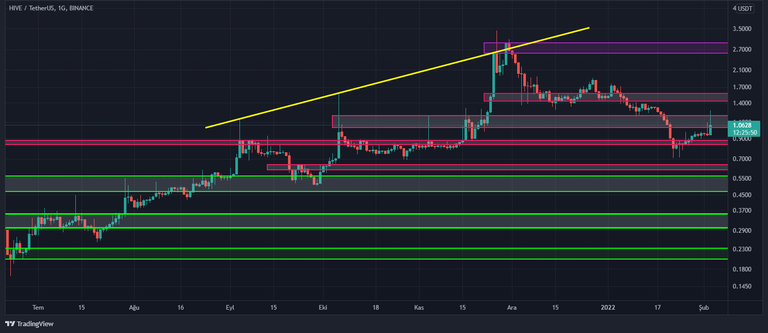
Let's start with the weekly chart first. Halfway through January, there was a sharp drop in Bitcoin and other cryptocurrencies. Hive was also affected by this decrease. It touched the $0.7 level of the candlesticks. However, reaction purchases came from the supply-demand region of 0.82-0.88.
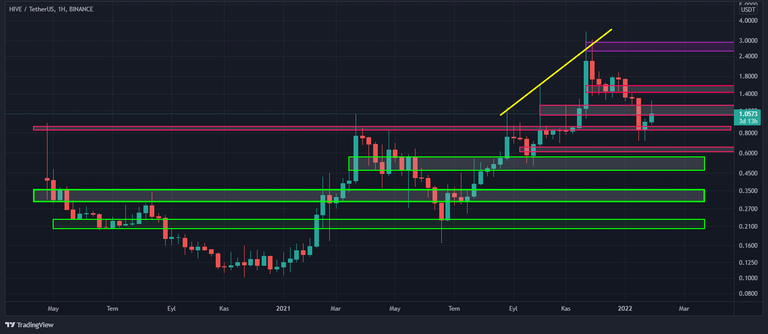
The chart above is daily. We are in the 1-1.2 supply-demand zone. Negative situations in the crypto money market still continue. However, the Hive volume has increased considerably since last night. There is a positive movement in the price. Below, it is necessary to follow the prices of $1, $0.9, $0.8 very well. It is necessary to follow the 1.2$ and 1.5$ prices above very well. In the long term, we should be concerned with the development of the Hive Blockchain.
This is not a bullish-bearish signal. And this post is not investment advice. You should make your investment decisions yourself according to your psychological state and your financial situation. It would be more helpful to see this sharing as an educational work. See you.
Have a !PIZZA
!LOLZ
lolztoken.com
He wanted to take up residence.
Credit: reddit
@anadolu, I sent you an $LOLZ on behalf of @steem82868
Use the !LOL or !LOLZ command to share a joke and an $LOLZ. (6/6)
Thank You :)
PIZZA Holders sent $PIZZA tips in this post's comments:
@steem82868(8/10) tipped @anadolu (x1)
Join us in Discord!
Yay! 🤗
Your content has been boosted with Ecency Points, by @anadolu.
Use Ecency daily to boost your growth on platform!
Support Ecency
Vote for new Proposal
Delegate HP and earn more